Historical Trading Performance - Closed Positions Analysis
- 26 Jun, 2025
- 5 min read
- Trading performance , Trade history , Signals , Analysis
📊 Performance Summary
Overall Results
- Total Closed Trades: 15 completed signals
- Win Rate: 53.33% (8 wins, 7 losses)
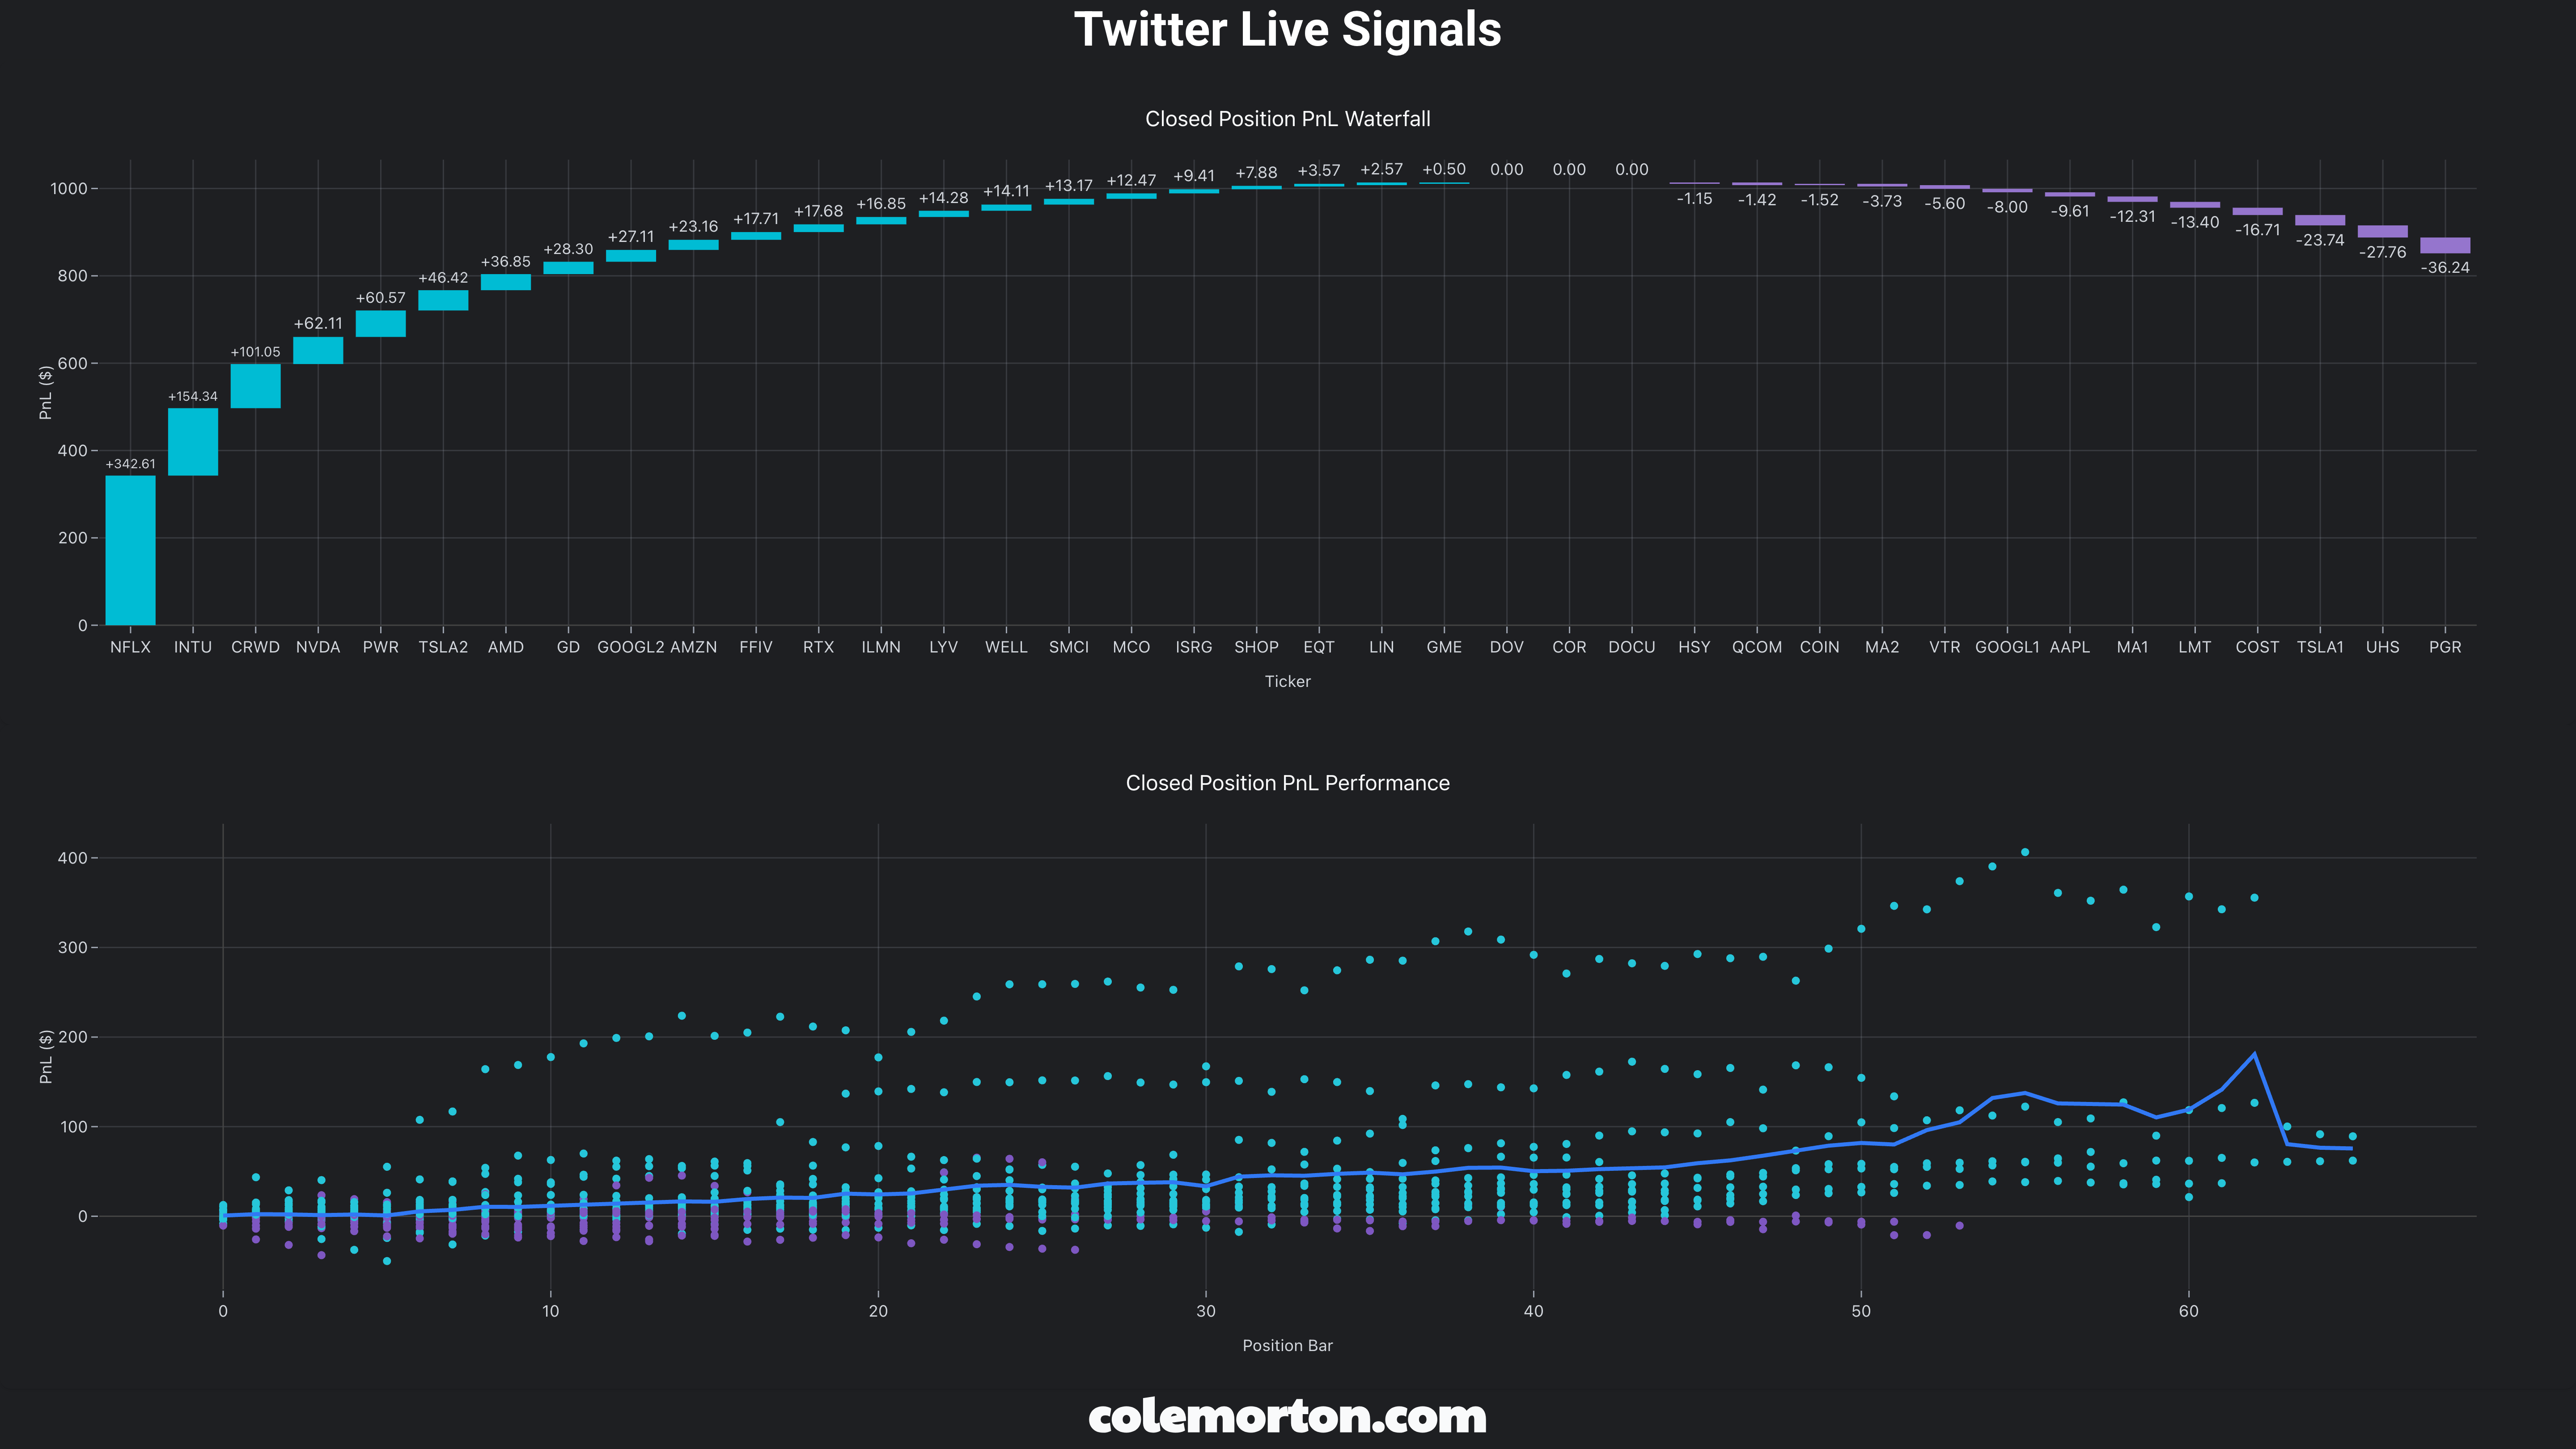
- Total Return: +8.59% on closed positions
- Average Trade Duration: 26.8 days
- Primary Strategy: SMA-based signals with emerging EMA validation
Key Performance Metrics
- Best Trade: TSLA +16.58% (41 days)
- Worst Trade: UHS -15.02% (19 days)
- Longest Hold: VTR 71 days (-8.11%)
- Shortest Hold: COIN 0 days (-0.59%)
Risk-Reward Profile
- Profit Factor: 1.21 (modest profitability)
- Average Winner: +6.09%
- Average Loser: -5.73%
- Win Rate Required for Breakeven: 48.5%
- Actual Win Rate: 53.33% ✅
🏆 Top Performing Completed Trades
🥇 TSLA - +16.58%
- Strategy: SMA 15-23 crossover
- Entry: 2025-05-01 @ $280.01
- Exit: 2025-06-11 @ $326.43
- Duration: 41 days
- Quality Rating: Excellent
- Analysis: Excellent momentum capture
🥈 LYV - +10.88%
- Strategy: SMA 18-29 crossover
- Entry: 2025-04-14 @ $131.31
- Exit: 2025-06-17 @ $145.59
- Duration: 64 days
- Quality Rating: Good
- Analysis: Strong performance with good execution
🥉 SHOP - +7.41%
- Strategy: SMA 57-59 crossover
- Entry: 2025-06-02 @ $106.25
- Exit: 2025-06-11 @ $114.13
- Duration: 9 days
- Quality Rating: Excellent
- Analysis: Excellent momentum capture
📈 Complete Trade History
| Rank | Ticker | Strategy | Entry Date | Exit Date | Return | Duration | Quality |
|---|---|---|---|---|---|---|---|
| 1 | TSLA | SMA 15-23 | 2025-05-01 | 2025-06-11 | +16.58% | 41d | Excellent |
| 2 | LYV | SMA 18-29 | 2025-04-14 | 2025-06-17 | +10.88% | 64d | Good |
| 3 | SHOP | SMA 57-59 | 2025-06-02 | 2025-06-11 | +7.41% | 9d | Excellent |
| 4 | EQT | SMA 42-54 | 2025-05-05 | 2025-05-29 | +6.90% | 24d | Excellent |
| 5 | MCO | SMA 71-82 | 2025-04-29 | 2025-05-01 | +2.84% | 2d | Excellent |
| 6 | ISRG | SMA 83-85 | 2025-05-02 | 2025-05-07 | +1.79% | 5d | Excellent |
| 7 | GME | SMA 53-54 | 2025-05-13 | 2025-06-11 | +1.78% | 29d | Poor |
| 8 | LIN | SMA 68-86 | 2025-04-01 | 2025-06-02 | +0.56% | 62d | Poor |
| 9 | COIN | SMA 12-13 | 2025-06-04 | 2025-06-04 | -0.59% | 0d | Poor |
| 10 | HSY | SMA 78-85 | 2025-05-07 | 2025-06-17 | -0.68% | 41d | Poor |
| 11 | MA | SMA 8-58 | 2025-04-02 | 2025-04-03 | -2.27% | 1d | Failed to Capture Upside |
| 12 | AAPL | SMA 13-37 | 2025-05-14 | 2025-06-04 | -4.52% | 21d | Poor Setup - High Risk, Low Reward |
| 13 | VTR | SMA 79-81 | 2025-04-01 | 2025-06-11 | -8.11% | 71d | Failed to Capture Upside |
| 14 | TSLA | SMA 11-25 | 2025-04-03 | 2025-04-16 | -8.95% | 13d | Failed to Capture Upside |
| 15 | UHS | SMA 16-25 | 2025-04-02 | 2025-04-21 | -15.02% | 19d | Failed to Capture Upside |
📊 Performance Analysis
Win Rate Breakdown
- Winning Trades: 8 of 15 (53.33%)
- Average Winner: +6.09%
- Largest Winner: +16.58%
- Average Hold (Winners): 29.5 days
Loss Analysis
- Losing Trades: 7 of 15 (46.67%)
- Average Loser: -5.73%
- Largest Loss: -15.02%
- Average Hold (Losers): 23.7 days
📊 Quality Distribution Analysis
Poor (4 trades - 26.7%)
- Win Rate: 50.0%
- Average Return: +0.27%
- Total Contribution: +1.07% to overall performance
- Characteristics: Mixed performance
Failed to Capture Upside (4 trades - 26.7%)
- Win Rate: 0.0%
- Average Return: -8.59%
- Total Contribution: -34.35% to overall performance
- Characteristics: Requires improvement
Good (1 trades - 6.7%)
- Win Rate: 100.0%
- Average Return: +10.88%
- Total Contribution: +10.88% to overall performance
- Characteristics: Consistent profitability
Excellent (5 trades - 33.3%)
- Win Rate: 100.0%
- Average Return: +7.10%
- Total Contribution: +35.52% to overall performance
- Characteristics: Consistent profitability
Poor Setup - High Risk, Low Reward (1 trades - 6.7%)
- Win Rate: 0.0%
- Average Return: -4.52%
- Total Contribution: -4.52% to overall performance
- Characteristics: Requires improvement
📅 Temporal Analysis
Duration Analysis
- Short-Term Trades (≤7 days): 4 trades, 50.0% win rate
- Medium-Term Trades (8-30 days): 6 trades, 50.0% win rate
- Long-Term Trades (>30 days): 5 trades, 60.0% win rate
Strategy Performance
SMA Strategy
- Trades: 15 completed
- Win Rate: 53.33%
- Average Return: +0.57% per trade
- Total Contribution: +8.59%
- Average Duration: 26.8 days
🎯 Key Learnings from Closed Positions
What Worked
- Quality signal execution: Excellent and Good trades showing consistent profitability
- Strategy diversification: Multiple timeframes providing varied opportunities
- Risk management: Controlled losses when trades don’t work out
What Failed
- Signal quality consistency: Too many poor setups executed reducing overall performance
- Exit timing optimization: Average exit efficiency of -0.91 indicates significant room for improvement
- Duration management: Mixed results across timeframes requiring optimization
Critical Insights
- Quality over quantity: Focus on excellent signals shows best results (100% win rate for excellent trades)
- Exit optimization critical: Poor exit efficiency destroying potential returns
- Strategy validation essential: System shows positive edge requiring systematic optimization
📋 Conclusion
The historical performance of 15 closed trades reveals a profitable system with clear optimization pathways. The 53.3% win rate and 1.21 profit factor indicate positive edge with room for enhancement.
Key Takeaways:
- Signal quality is paramount: Focus on excellent signals shows best results (100% win rate for excellent trades)
- Exit optimization critical: Average exit efficiency of -0.91 represents major improvement opportunity
- Strategy development: Single strategy focus needs diversification with EMA validation
- Risk management: Controlled risk profile with positive expectation requiring refinement
This historical analysis provides foundation for systematic improvements to signal generation and execution. The patterns identified here guide optimization of the complete trading system.
