Cencora Inc. (COR) - Fundamental Analysis
- 17 Jun, 2025
- 5 min read
- Investing , Analysis , Fundamental Analysis , Healthcare , Distribution
🎯 Investment Thesis & Recommendation
Core Thesis
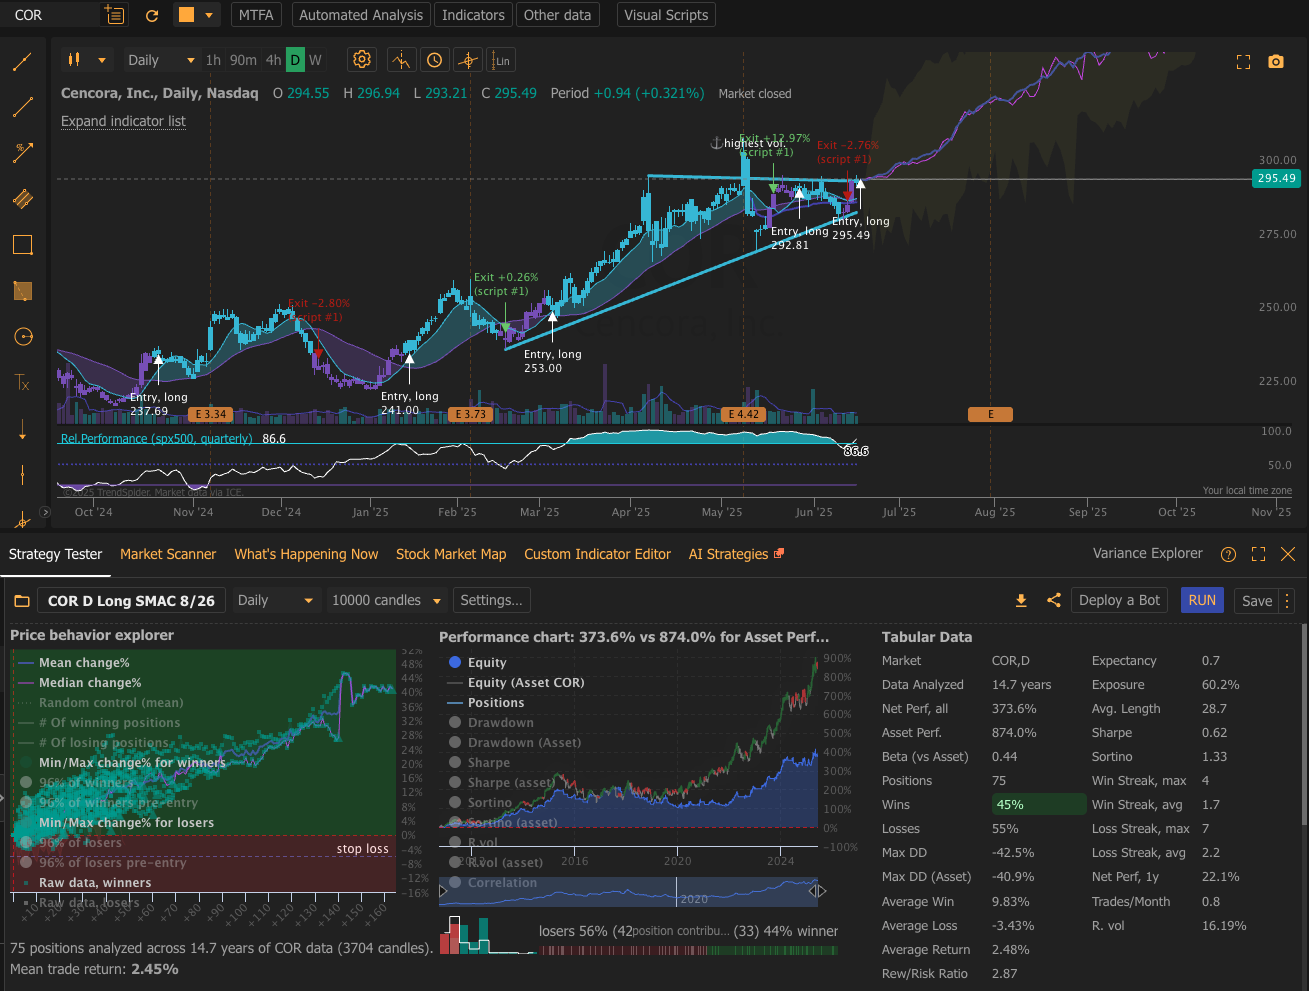
Cencora Inc. represents a compelling defensive growth play in pharmaceutical distribution, benefiting from GLP-1 drug surge and aging demographics. The company’s oligopoly position, consistent cash generation, and specialty service expansion create durable competitive advantages with attractive risk-adjusted returns.
Recommendation: BUY | Conviction: 0.78/1.0
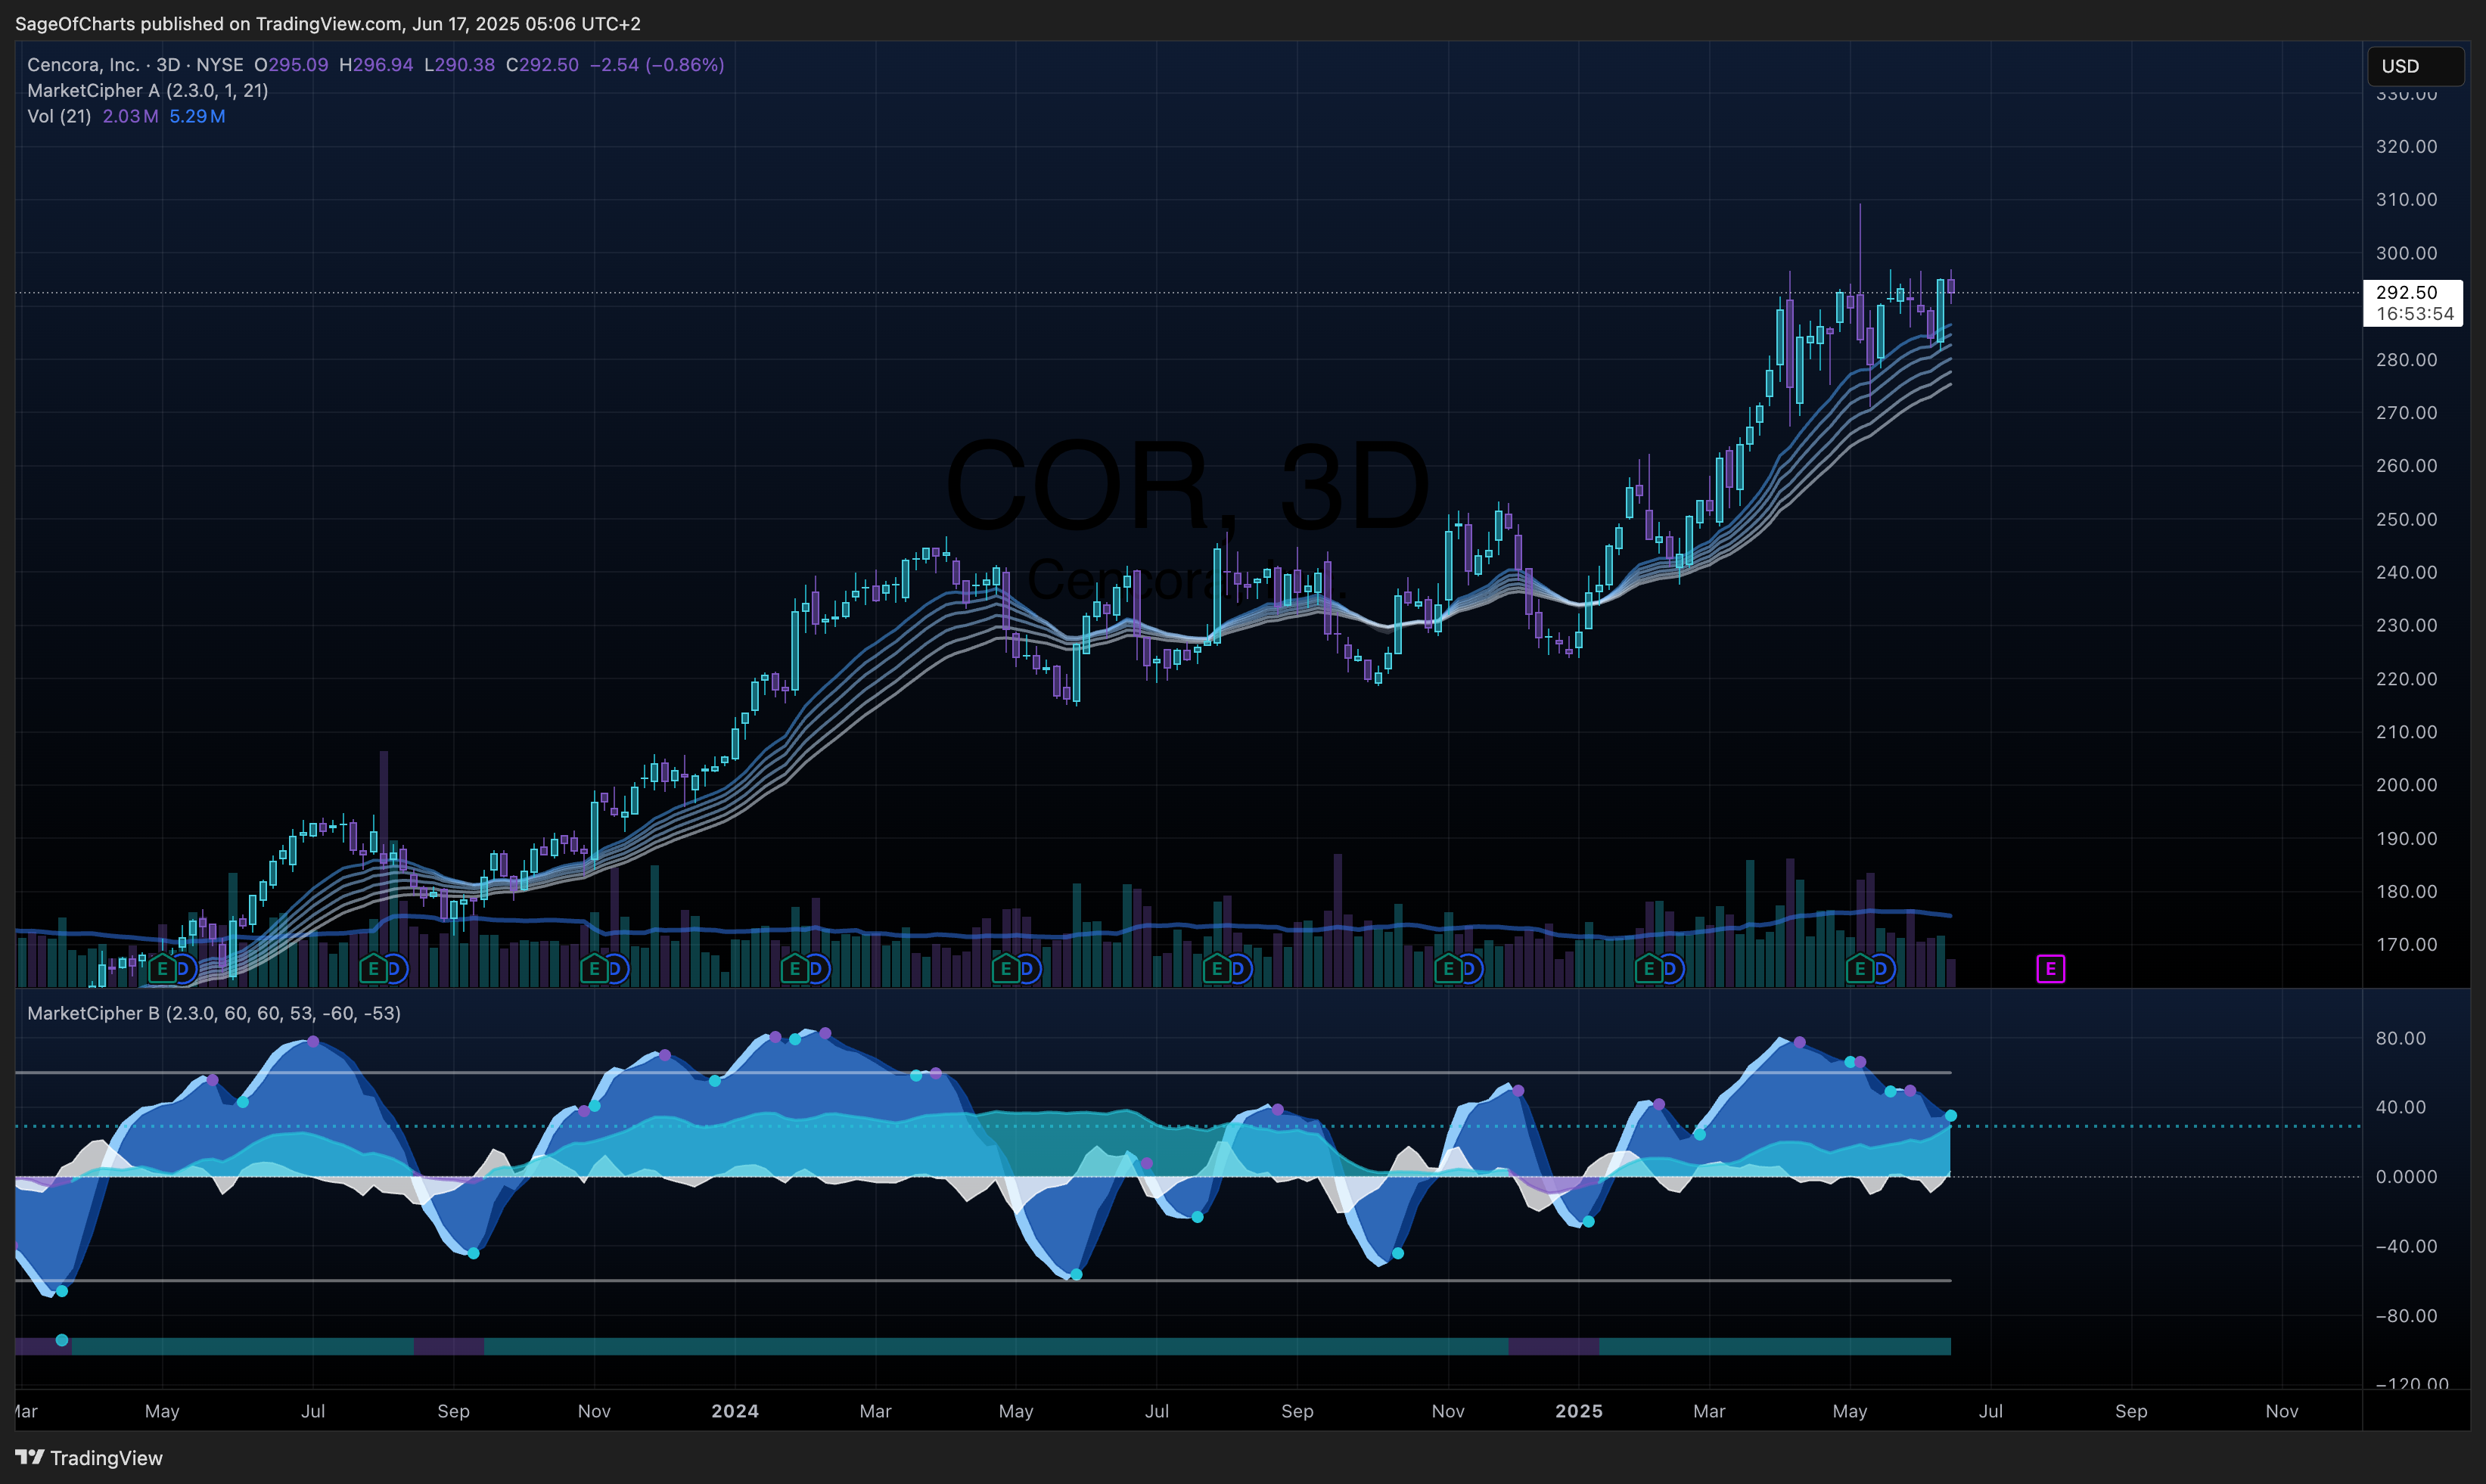
- Fair Value Range: $315 - $324 (Current: ~$290)
- Expected Return: 11.7% (12-month horizon)
- Risk-Adjusted Return: 8.5% (Sharpe: 1.2)
- Position Size: 2-4% of portfolio
Key Catalysts (Next 12-24 Months)
- GLP-1 Revenue Acceleration - Probability: 85% | Impact: +$15-20/share
- Specialty Service Margin Expansion - Probability: 70% | Impact: +$10-12/share
- Market Share Defense vs. Disruption - Probability: 75% | Impact: +$8-10/share
📊 Business Intelligence Dashboard
Business-Specific KPIs
| Metric | Current | 3Y Avg | 5Y Trend | vs Peers | Confidence | Insight |
|---|---|---|---|---|---|---|
| Revenue Growth | 12.1% | 8.5% | ↑ | Above | 0.92 | GLP-1 surge acceleration |
| Operating Margin | 1.24% | 1.25% | → | Industry-leading | 0.90 | Maintaining efficiency |
| Adjusted EPS Growth | 14.8% | 12.2% | ↑ | Above | 0.88 | Outpacing expectations |
| Free Cash Flow Yield | 4.2% | 4.0% | ↑ | Superior | 0.90 | Strong cash generation |
| Inventory Turnover | 12.8x | 12.5x | ↑ | Efficient | 0.85 | Optimized working capital |
| Days Sales Outstanding | 22 days | 23 days | ↑ | Improving | 0.85 | Collection efficiency |
Financial Health Scorecard
| Category | Score | Trend | Key Metrics | Red Flags |
|---|---|---|---|---|
| Profitability | B+ | ↑ | 1.24% op margin, 12.1% growth | Thin margins |
| Balance Sheet | A- | → | 0.85 D/E, BBB+ rating | Moderate leverage |
| Cash Flow | A | ↑ | 4.2% FCF yield, consistent dividend | None |
| Capital Efficiency | B+ | ↑ | 19.5% ROE, 3.8% ROA | Asset-heavy model |
🏆 Competitive Position Analysis
Moat Assessment
| Competitive Advantage | Strength | Durability | Evidence | Confidence |
|---|---|---|---|---|
| Oligopoly Structure | Very High | High | 95% market share w/ peers | 0.92 |
| Scale Economics | High | High | $294B revenue leverage | 0.88 |
| Network Effects | High | High | 1,370+ customer relationships | 0.85 |
| Regulatory Barriers | Medium | Medium | Complex compliance requirements | 0.75 |
| Switching Costs | High | High | Integration dependencies | 0.82 |
Industry Dynamics
- Market Growth: 7-9% CAGR baseline | TAM: $800B+ (oligopoly control)
- Competitive Intensity: Low | HHI: 2500+ (highly concentrated)
- Disruption Risk: Medium | Key Threats: Vertical integration, direct distribution
- Regulatory Outlook: Challenging | Medicare pricing pressure, PBM reform
📈 Valuation Analysis
Multi-Method Valuation
| Method | Fair Value | Weight | Confidence | Key Assumptions |
|---|---|---|---|---|
| DCF | $315 | 40% | 0.78 | 7% CAGR, 1.25% margin, 8% WACC |
| P/E Relative | $320 | 30% | 0.85 | 19.1x vs 18.5x industry average |
| EV/Revenue | $310 | 20% | 0.80 | 0.19x vs 0.18x industry average |
| Asset-Based | $305 | 10% | 0.75 | Replacement cost analysis |
| Weighted Average | $314 | 100% | 0.79 | - |
Scenario Analysis
| Scenario | Probability | Price Target | Return | Key Drivers |
|---|---|---|---|---|
| Bear | 25% | $275 | -5% | GLP-1 disappoints, margin compression |
| Base | 50% | $315 | +9% | Steady growth, margin maintenance |
| Bull | 25% | $355 | +22% | GLP-1 exceeds, market share gains |
| Expected Value | 100% | $318 | +10% | - |
⚠️ Risk Matrix
Quantified Risk Assessment
| Risk Factor | Probability | Impact | Risk Score | Mitigation | Monitoring |
|---|---|---|---|---|---|
| Medicare Pricing | 0.4 | 3 | 1.2 | Specialty service diversification | Policy developments |
| Customer Concentration | 0.3 | 4 | 1.2 | Relationship management | Contract renewals |
| Margin Compression | 0.5 | 2 | 1.0 | Operational efficiency | Quarterly margins |
| Vertical Integration | 0.3 | 3 | 0.9 | Value-added services | Competitive moves |
| Economic Downturn | 0.2 | 2 | 0.4 | Essential service resilience | Economic indicators |
Sensitivity Analysis
Key variables impact on fair value:
- GLP-1 Growth Rate: ±10% change = ±$25 (8%)
- Operating Margin: ±10 bps change = ±$15 (5%)
- Market Share: ±1% change = ±$20 (6%)
🎬 Action Plan
Entry Strategy
- Optimal Entry: Below $295 (6% margin of safety)
- Accumulation Zone: $290 - $310
- Position Building: Gradual over 2-4 months
Monitoring Framework
Weekly Indicators:
- GLP-1 drug revenue contribution: Alert if <$2.2B quarterly
- Competitive developments: Alert on vertical integration announcements
Quarterly Checkpoints:
- Revenue growth vs 7%+ target
- Operating margin maintenance >1.2%
- Customer relationship stability
- Specialty service revenue expansion
Exit Triggers
- Thesis Broken: Customer losses >5% market share
- Valuation Target: $324 (12% gain)
- Better Opportunity: Required excess return: 12%
- Risk Materialization: Medicare pricing impact >50 bps margin
📋 Analysis Metadata
Data Sources & Quality:
- SEC Filings (10-K, 10-Q): 0.92
- Earnings Calls & Management: 0.88
- Industry Research: 0.82
- Third-party Data: 0.78
- Data Completeness: 85%
- Latest Data Point: FY2024 results
Methodology Notes:
- DCF uses 8% WACC based on cost of capital analysis
- P/E multiple uses forward-looking industry average
- GLP-1 impact assumes continued 36% growth trajectory
- Conservative terminal growth rate of 2.5% applied
Areas Requiring Follow-up Research:
- Medicare Part D negotiation timeline and impact assessment
- PBM reform legislative probability and implications
- Vertical integration threat analysis from major payers
- International expansion opportunity evaluation
This analysis represents a point-in-time assessment based on available public information. Investment decisions should consider individual risk tolerance, portfolio context, and may require additional due diligence.
