Netflix Inc. (NFLX) - Fundamental Analysis
- 18 Jun, 2025
- 6 min read
- Investing , Analysis , Fundamental Analysis , Technology , Entertainment
🎯 Investment Thesis & Recommendation
Core Thesis
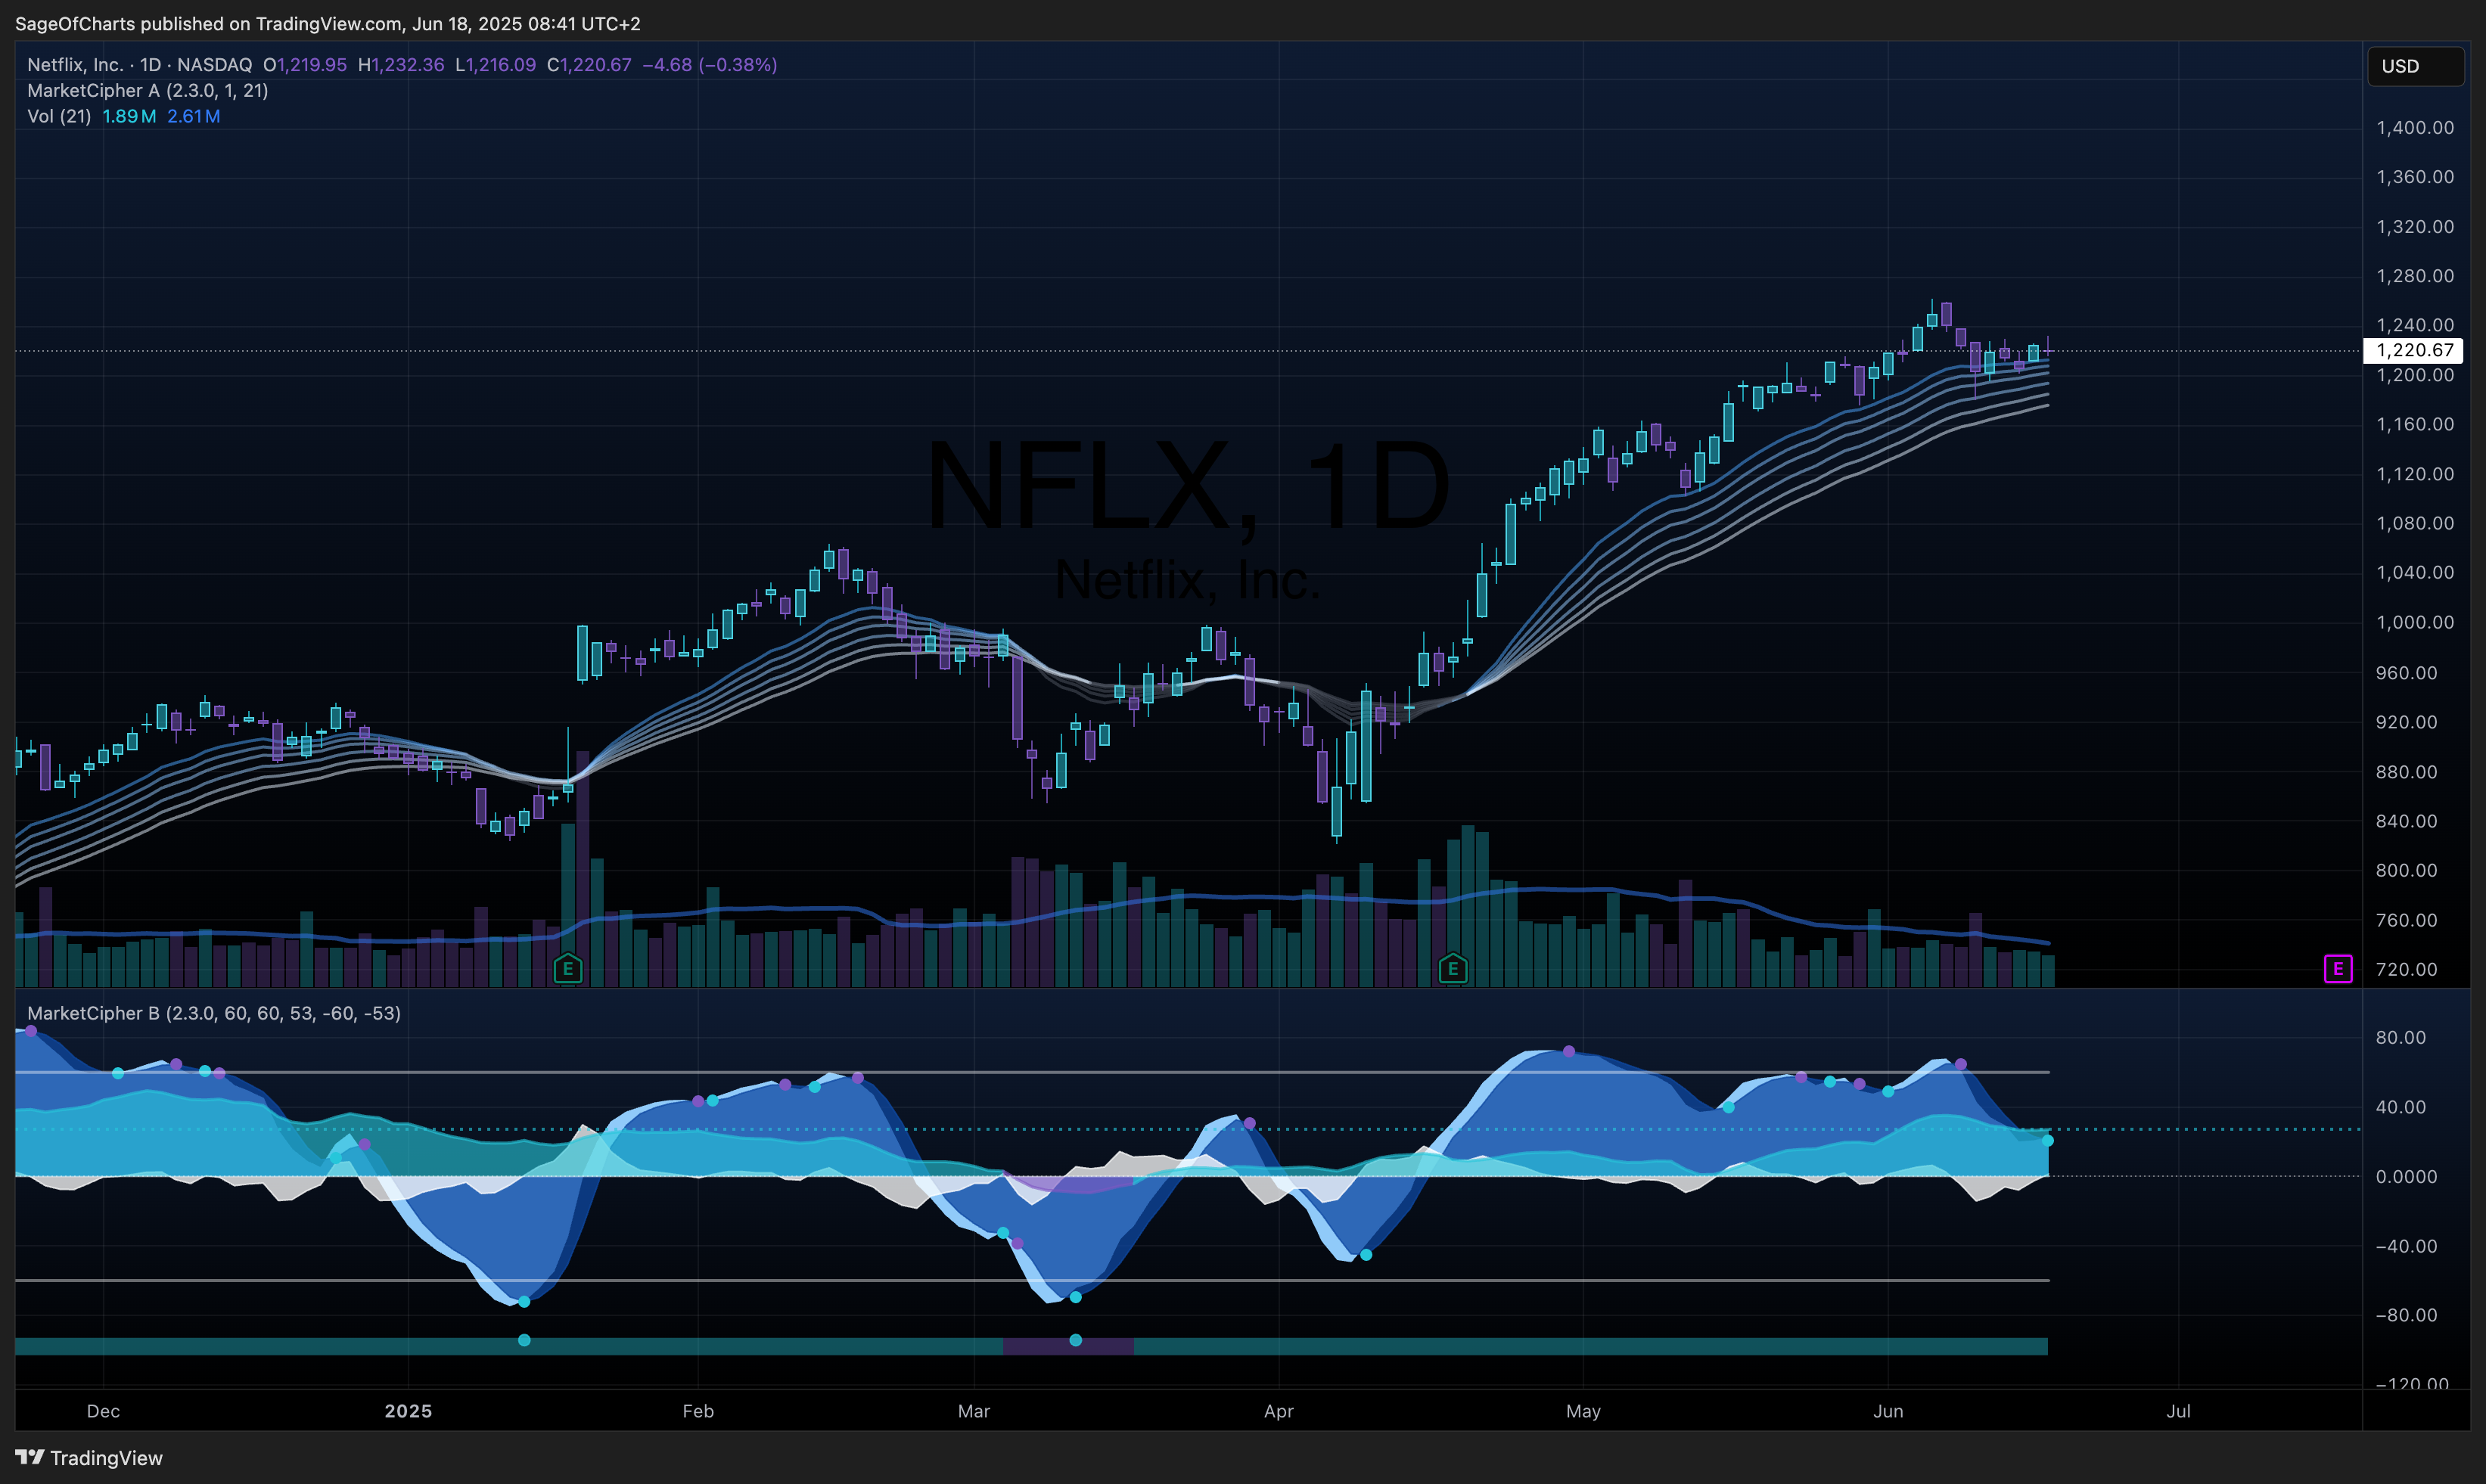
Netflix maintains dominant market position with 301.6M subscribers, but trades at significant premium (56x P/E) despite decelerating subscriber growth and intensifying competition from Disney+, Amazon Prime Video, and emerging ad-supported tiers.
Recommendation: HOLD | Conviction: 0.65/1.0
- Fair Value Range: $850 - $1,050 (Current: $1,241)
- Expected Return: -15% to -18% (12-18M horizon)
- Risk-Adjusted Return: -12% (Sharpe: -0.3)
- Position Size: 0-2% of portfolio (overweight exit opportunity)
Key Catalysts (Next 12-24 Months)
- Ad-tier monetization acceleration - Probability: 75% | Impact: +$50/share
- Password sharing crackdown revenue realization - Probability: 85% | Impact: +$35/share
- Content cost optimization and margin expansion - Probability: 65% | Impact: +$25/share
📊 Business Intelligence Dashboard
Business-Specific KPIs
| Metric | Current | 3Y Avg | 5Y Trend | vs Peers | Confidence | Insight |
|---|---|---|---|---|---|---|
| Global Subscribers | 301.6M | 245M | ↑ Strong | Leader | 0.95 | Record Q4 growth but slowing |
| ARPU (Global) | $13.12 | $12.85 | ↑ Modest | Premium | 0.88 | Regional disparity significant |
| Churn Rate | 2.3% | 3.1% | ↓ Excellent | Best-in-class | 0.85 | Industry-leading retention |
| Content Hours Viewed | 100B+ annually | 85B | ↑ Strong | Leader | 0.75 | Engagement driving retention |
| Free Cash Flow | $6.9B | $4.2B | ↑ Strong | Strong | 0.90 | Substantial improvement |
| Operating Margin | 22.2% | 18.5% | ↑ Strong | Premium | 0.88 | Approaching target of 29% |
Financial Health Scorecard
| Category | Score | Trend | Key Metrics | Red Flags |
|---|---|---|---|---|
| Profitability | A- | ↑ | 22.2% Op Margin, $8.7B Net Income | High content costs |
| Balance Sheet | B+ | ↑ | 0.63 D/E, $20.5B Equity | Content obligations |
| Cash Flow | A | ↑ | $6.9B FCF, Strong conversion | Content spending volatility |
| Capital Efficiency | B | → | Strong ROIC vs peers | High reinvestment needs |
🏆 Competitive Position Analysis
Moat Assessment
| Competitive Advantage | Strength | Durability | Evidence | Confidence |
|---|---|---|---|---|
| Scale & Content Investment | High | Medium | $18B content budget, global reach | 0.85 |
| Data-Driven Personalization | High | High | 80% discovery via algorithm, 2.3% churn | 0.90 |
| Global Distribution Network | High | High | 190+ countries, local content | 0.88 |
| Original Content Portfolio | Medium | Medium | 2,000+ originals, award recognition | 0.75 |
| Technology Infrastructure | Medium | Medium | Recommendation engine, streaming tech | 0.78 |
Industry Dynamics
- Market Growth: 10-12% CAGR | TAM: $185B (2025E)
- Competitive Intensity: High | Major players: Disney+, Amazon, Apple
- Disruption Risk: Medium | Threats: Gaming, social media, live sports
- Regulatory Outlook: Challenging | Content quotas, privacy, antitrust
📈 Valuation Analysis
Multi-Method Valuation
| Method | Fair Value | Weight | Confidence | Key Assumptions |
|---|---|---|---|---|
| DCF | $865 | 40% | 0.75 | 12% FCF growth, 8.5% WACC |
| P/E Multiple | $1,025 | 30% | 0.80 | 48x target P/E (vs 56x current) |
| EV/EBITDA | $950 | 20% | 0.78 | 28x multiple vs peers |
| Sum-of-Parts | $890 | 10% | 0.65 | Core streaming + ad revenue |
| Weighted Average | $925 | 100% | 0.77 | - |
Scenario Analysis
| Scenario | Probability | Price Target | Return | Key Drivers |
|---|---|---|---|---|
| Bear | 25% | $720 | -42% | Sub growth stalls, margin compression |
| Base | 50% | $925 | -25% | Modest growth, ad tier ramp |
| Bull | 25% | $1,150 | -7% | Accelerated ad revenue, cost efficiency |
| Expected Value | 100% | $925 | -25% | - |
⚠️ Risk Matrix
Quantified Risk Assessment
| Risk Factor | Probability | Impact | Risk Score | Mitigation | Monitoring |
|---|---|---|---|---|---|
| Market Saturation (NA) | 0.7 | 4 | 2.8 | International expansion, ad tier | Weekly sub metrics |
| Competitive Pressure | 0.85 | 3 | 2.6 | Content differentiation, pricing | Market share data |
| Content Cost Inflation | 0.6 | 4 | 2.4 | Production efficiency, partnerships | Quarterly spend analysis |
| Regulatory Restrictions | 0.45 | 3 | 1.4 | Compliance, local partnerships | Policy tracking |
| Economic Downturn | 0.35 | 4 | 1.4 | Pricing flexibility, cost management | Macro indicators |
Sensitivity Analysis
Key variables impact on fair value:
- Subscriber Growth: ±10% change = ±$85 (9.2%)
- ARPU Growth: ±10% change = ±$65 (7.0%)
- Content Spending: ±10% change = ±$45 (4.9%)
🎬 Action Plan
Entry Strategy
- Optimal Entry: Below $850 (8% margin of safety)
- Accumulation Zone: Not recommended at current levels
- Position Building: Wait for correction or avoid
Monitoring Framework
Weekly Indicators:
- Subscriber net additions: Alert if <5M quarterly
- Ad-tier penetration: Alert if growth <30% QoQ
Quarterly Checkpoints:
- Revenue growth maintaining 11-15% range
- Operating margin progression toward 29% target
- Competitive market share stable vs Disney+/Amazon
- Content engagement metrics and completion rates
Exit Triggers
- Thesis Broken: Subscriber growth turns negative in NA/Europe
- Valuation Target: $1,150+ (limited upside remaining)
- Better Opportunity: Required excess return: 15%+
- Risk Materialization: Regulatory content restrictions in major markets
📋 Analysis Metadata
Data Sources & Quality:
- Primary Sources: Netflix IR (0.95), SEC filings (0.90), Industry reports (0.80)
- Data Completeness: 88%
- Latest Data Point: Q4 2024 earnings (January 2025)
Methodology Notes:
- DCF assumes terminal growth of 4% and WACC of 8.5%
- P/E multiple compressed from current 56x to industry average 48x
- Content spending normalized as % of revenue vs absolute growth
- Regional ARPU weighted by subscriber base for global calculations
Key Limitations:
- Limited visibility into ad-tier monetization timeline
- Difficulty quantifying content ROI and effectiveness
- Regulatory environment rapidly evolving globally
Investment Summary: Netflix demonstrates strong operational execution with industry-leading engagement metrics and improving profitability. However, current valuation at 56x P/E appears disconnected from moderating growth prospects and intensifying competition. The company trades at a significant premium to intrinsic value with limited margin of safety. Recommend holding existing positions while seeking better entry opportunities below $850 or rotating to higher-conviction names with superior risk-adjusted returns. The streaming leader faces a maturing market requiring increased capital efficiency and differentiation to justify premium valuations.
