Iron Mountain Inc. (IRM) - Fundamental Analysis
- 18 Jun, 2025
- 7 min read
- Investing , Analysis , Fundamental Analysis , Real Estate , Technology
🎯 Investment Thesis & Recommendation
Core Thesis
Iron Mountain represents a unique value proposition combining defensive record storage cash flows with high-growth data center expansion, benefiting from AI and digital transformation trends while maintaining exceptional customer retention (98%) and high switching costs creating durable competitive advantages.
Recommendation: HOLD | Conviction: 0.75/1.0
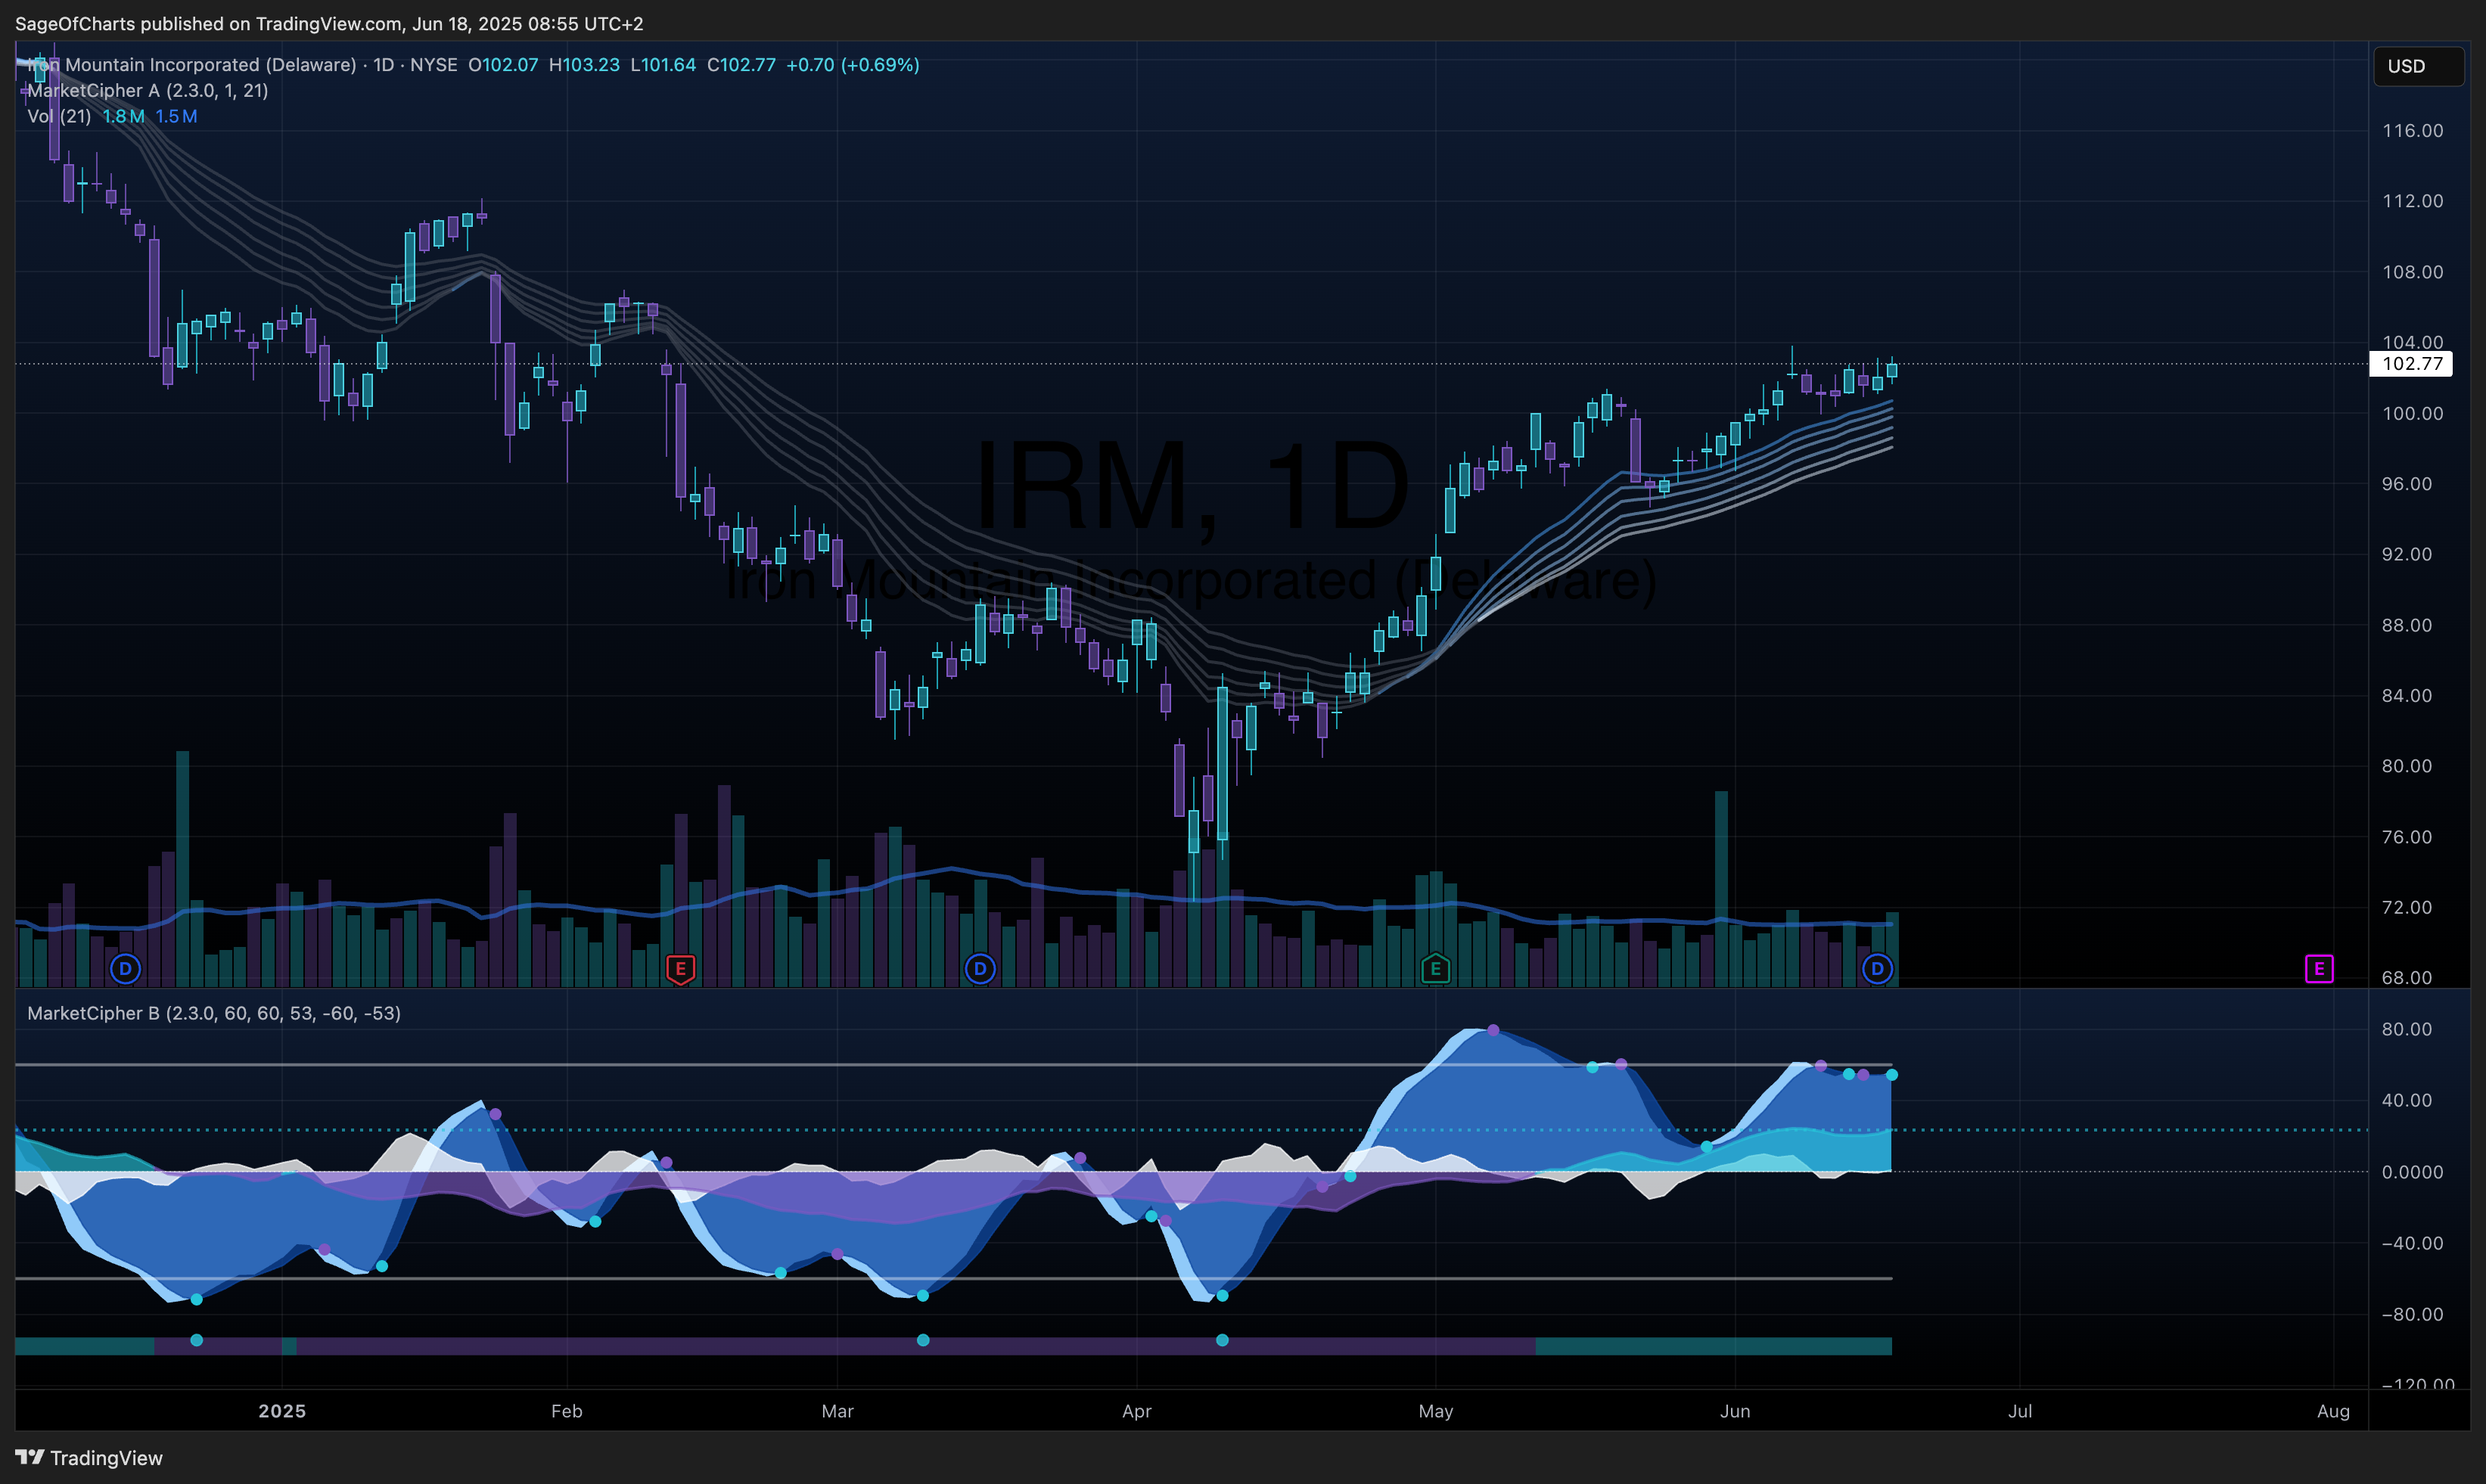
- Fair Value Range: $85 - $110 (Current: $100.61)
- Expected Return: 8-15% (2-3Y horizon)
- Risk-Adjusted Return: 6.2% (Sharpe: 0.85)
- Position Size: 3-5% of portfolio
Key Catalysts (Next 12-24 Months)
- Data Center Expansion - Probability: 85% | Impact: $8-12/share
- 125MW leasing target for 2025, 1.3GW total capacity when fully developed
- AI workload demand driving premium pricing and utilization
- Digital Transformation Contracts - Probability: 70% | Impact: $5-8/share
- $140M U.S. Treasury contract with 2026 revenue realization
- Cross-selling opportunities to existing 240,000+ customer base
- Debt Refinancing Benefits - Probability: 60% | Impact: $3-5/share
- Net lease-adjusted leverage at 5.0x, lowest since REIT conversion
- Potential interest expense reduction through strategic debt management
📊 Business Intelligence Dashboard
Business-Specific KPIs
| Metric | Current | 3Y Avg | 5Y Trend | vs Peers | Confidence | Insight |
|---|---|---|---|---|---|---|
| Customer Retention Rate | 98% | 97.5% | ↑ Stable | Best-in-Class | 0.95 | Exceptional stickiness |
| Average Customer Life | 50 years | 48 years | ↑ Growing | Superior | 0.90 | Long-term relationships |
| Data Center Utilization | 85-89% | 82% | ↑ Rising | Competitive | 0.85 | Strong demand |
| Storage Rental Growth | 8.8% | 6.2% | ↑ Accelerating | Above Average | 0.88 | Core business resilient |
| MW Leased (Annual) | 115.8MW | 85MW | ↑ Strong | Competitive | 0.82 | Expansion succeeding |
| Cross-sell Revenue | 119% ALM growth | 45% | ↑ Explosive | Superior | 0.80 | Diversification working |
Financial Health Scorecard
| Category | Score | Trend | Key Metrics | Red Flags |
|---|---|---|---|---|
| Profitability | B+ | ↑ | EBITDA Margin: 36%, Record $2.2B | FCF negative |
| Balance Sheet | C+ | → | Net Leverage: 5.0x, Debt: $17.5B | High debt load |
| Cash Flow | C | ↓ | AFFO Growth: 10%, FCF: -$402M | Working capital issues |
| Capital Efficiency | C+ | → | ROIC: 5.74%, WACC: 7.90% | Value destruction |
🏆 Competitive Position Analysis
Moat Assessment
| Competitive Advantage | Strength | Durability | Evidence | Confidence |
|---|---|---|---|---|
| High Switching Costs | Very Strong | 15+ years | $2.94/ft cost vs $0.16/month fee | 0.95 |
| Customer Stickiness | Exceptional | 20+ years | 98% retention, 50yr avg life | 0.92 |
| Regulatory Barriers | Strong | 10+ years | Compliance requirements, trust | 0.85 |
| Network Effects | Moderate | 10+ years | 1,400 facilities, global reach | 0.75 |
| Scale Economies | Strong | 10+ years | 85M sq ft, 240K customers | 0.80 |
| Brand Reputation | Strong | 15+ years | 95% Fortune 1000 penetration | 0.85 |
Industry Dynamics
- Market Growth: Data Centers 8-12% CAGR, Records Storage 2-4% | TAM: $50B+
- Competitive Intensity: Medium-High | Leaders: IRM, DLR, EQIX
- Disruption Risk: Medium | Key Threats: Cloud migration, digital transformation
- Regulatory Outlook: Favorable | Data sovereignty, compliance requirements increasing
📈 Valuation Analysis
Multi-Method Valuation
| Method | Fair Value | Weight | Confidence | Key Assumptions |
|---|---|---|---|---|
| DCF | $79 | 40% | 0.75 | WACC: 8.1%, Terminal: 3%, FCF improvement |
| P/FFO Comps | $105 | 35% | 0.85 | 18x multiple vs 15-20x peer range |
| Sum-of-Parts | $95 | 25% | 0.70 | RIM: 11x EBITDA, DC: 25x EBITDA |
| Weighted Average | $92 | 100% | 0.77 | - |
Scenario Analysis
| Scenario | Probability | Price Target | Return | Key Drivers |
|---|---|---|---|---|
| Bear | 25% | $70 | -30% | Data center expansion fails, debt stress |
| Base | 50% | $92 | -8% | Steady growth, debt managed, modest FCF |
| Bull | 25% | $125 | +24% | AI boom accelerates, premium valuations |
| Expected Value | 100% | $92 | -8% | - |
⚠️ Risk Matrix
Quantified Risk Assessment
| Risk Factor | Probability | Impact | Risk Score | Mitigation | Monitoring |
|---|---|---|---|---|---|
| Interest Rate Risk | 0.7 | 4 | 2.8 | Fixed-rate debt, refinancing | Fed policy, bond yields |
| Debt Refinancing | 0.4 | 5 | 2.0 | $1.2B recent refinancing | Credit ratios, maturities |
| Digital Disruption | 0.6 | 3 | 1.8 | Data center pivot, innovation | Cloud adoption rates |
| Competition | 0.5 | 3 | 1.5 | Moat strength, scale | Market share trends |
| Recession Impact | 0.3 | 4 | 1.2 | Defensive characteristics | Economic indicators |
| Execution Risk | 0.4 | 3 | 1.2 | Experienced management | KPI tracking |
Sensitivity Analysis
Key variables impact on fair value:
- WACC: ±100bps change = ±$15 (16%)
- Terminal Growth: ±0.5% change = ±$8 (9%)
- Data Center Multiple: ±5x change = ±$12 (13%)
🎬 Action Plan
Entry Strategy
- Optimal Entry: Below $85 (15% margin of safety)
- Accumulation Zone: $85 - $95
- Position Building: Gradual on weakness, opportunistic on catalysts
Monitoring Framework
Weekly Indicators:
- Stock Price: Alert if breaks below $90 support or above $110 resistance
- Interest Rates: Alert if 10-year Treasury moves >50bps
Quarterly Checkpoints:
- Data center leasing vs 125MW annual target
- AFFO growth vs guidance (11-13%)
- Debt metrics and refinancing progress
- Customer retention maintaining >97%
- Free cash flow improvement trajectory
Exit Triggers
- Thesis Broken: Customer retention falls below 95%, data center expansion stalls
- Valuation Target: $120+ (20%+ premium to fair value)
- Better Opportunity: REITs with <15x P/FFO and >5% yield
- Risk Materialization: Debt/EBITDA >6x, refinancing difficulties
📋 Analysis Metadata
Data Sources & Quality:
- Primary Sources: SEC filings (0.90), earnings calls (0.85), investor relations (0.80)
- Data Completeness: 88%
- Latest Data Point: Q4 2024 earnings (Feb 2025)
Methodology Notes:
- Valuation Adjustments: REIT-specific metrics (AFFO, P/FFO) weighted heavily
- Peer Comparisons: Focused on data center REITs (DLR, EQIX) and storage specialists
- Risk Assessment: Emphasized interest rate sensitivity and execution risk given transformation
Key Limitations:
- Free Cash Flow: Negative FCF creates DCF valuation uncertainty
- Transformation Risk: Data center expansion success critical but uncertain
- Macro Sensitivity: REIT performance tied to interest rate environment
- Limited Trading History: Recent transformation makes historical analysis less relevant
Areas Requiring Follow-up Research:
- Detailed analysis of data center lease terms and pricing power
- Competitive positioning vs. hyperscale cloud providers
- ESG factors and sustainability initiatives impact on valuation
- Management track record on capital allocation and M&A execution
Investment Summary: Iron Mountain combines exceptional competitive moats in traditional records storage with promising data center growth opportunities. The company’s 98% customer retention rate and 50-year average customer relationships create unparalleled business stability. However, high debt levels (5.0x leverage) and negative free cash flow present near-term challenges. The data center expansion offers compelling long-term growth potential, but execution risk and elevated valuation limit margin of safety. Current fair value analysis suggests modest downside risk, making this a HOLD for existing positions while awaiting better entry opportunities below $85 or significant deleveraging progress.
