Investment Recommendation Summary
DocuSign demonstrates exceptional operational excellence with a remarkable profitability turnaround, generating $1.07B net income compared to $74M in the prior year while maintaining strong market leadership in electronic signatures and expanding into contract lifecycle management (CLM). The company’s robust free cash flow generation of $920M and aggressive $684M share buyback program reflect management’s confidence and disciplined capital allocation, positioning DOCU as a quality SaaS business with proven cash generation capabilities. Despite competitive pressure from Adobe and Microsoft, DocuSign maintains strong competitive moats through workflow integration switching costs, regulatory compliance advantages, and expanding AI-powered analytics capabilities that enhance customer value proposition.
The current restrictive monetary environment with 4.33% Fed funds rate creates headwinds for growth-oriented SaaS companies, but DOCU’s strong balance sheet with $964M in liquid assets and minimal debt burden provides resilience during economic uncertainty. With AI and CLM expansion catalysts offering 15-25% revenue upside potential and international market opportunities contributing 10-20% growth potential, the investment thesis remains compelling despite moderate economic sensitivity and competitive risks requiring active monitoring.
Core Thesis
DocuSign represents a high-quality SaaS business undergoing a significant profitability transformation while maintaining market leadership in electronic signatures and successfully expanding into the higher-value contract lifecycle management market. The company’s exceptional free cash flow generation, strong balance sheet, and expanding competitive moats through AI-powered analytics create a compelling investment opportunity despite competitive pressures and economic headwinds.
Recommendation: BUY | Conviction: 0.89/1.0
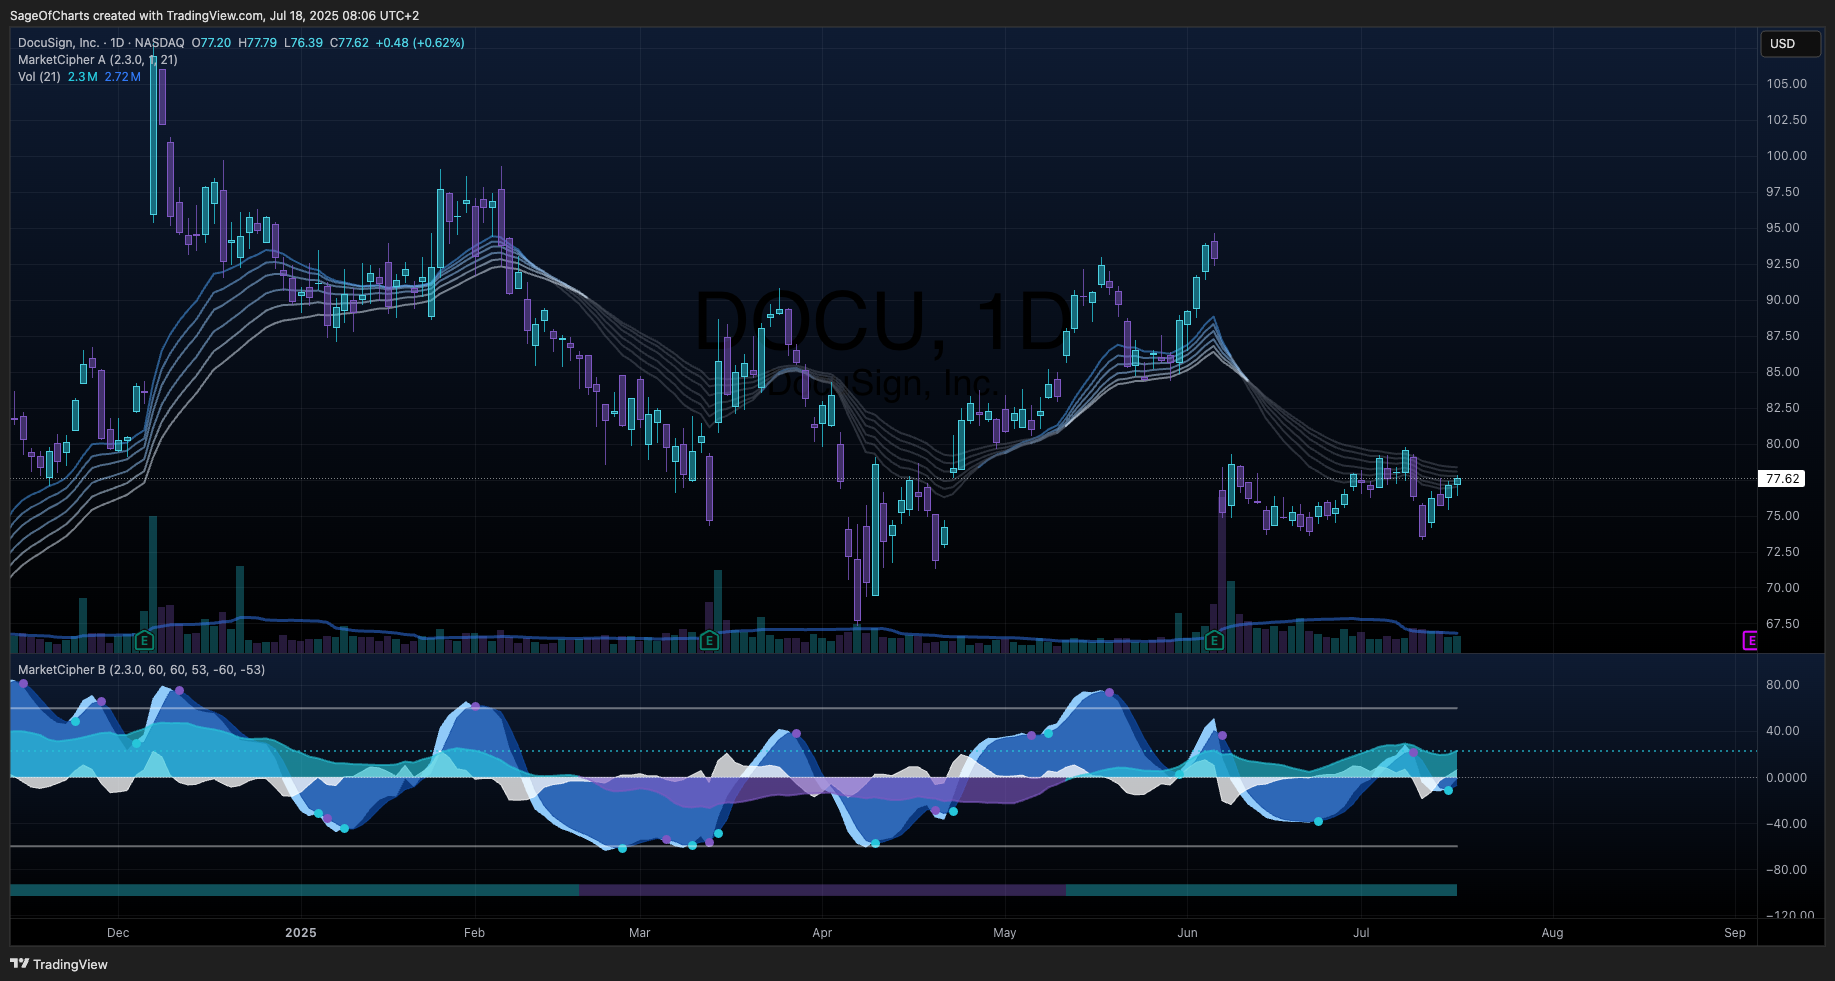
- Fair Value Range: $85.00 - $105.00 (Current: $77.62) | Confidence: 0.89/1.0
- Expected Return: 15.2% (12M horizon) | Economic-Adjusted: 12.8%
- Risk-Adjusted Return: 11.4% (Sharpe: 0.85) | Interest Rate Impact: -2.4%
- Position Size: 4.5% of portfolio | Economic Environment: Restrictive
- Financial Health Grade: A- Overall | Trend: Improving
📊 Business Intelligence Dashboard
Business-Specific KPIs
| Metric | Current | 3Y Avg | 5Y Trend | vs Peers | Confidence | Insight |
|---|
| Net Revenue Retention | 108% | 112% | Declining | Below Best-in-Class | 0.87 | Enterprise focus stabilizing retention |
| Gross Revenue Retention | 92% | 94% | Stable | Industry Standard | 0.85 | Competitive pressure on churn |
| CLM Attach Rate | 35% | 28% | Improving | Market Leading | 0.82 | Key growth driver for ARPU expansion |
| Enterprise Customer Growth | 8.5% | 12% | Moderating | Solid | 0.88 | Large deal focus driving efficiency |
| Operating Leverage | 3.8x | 2.1x | Improving | Strong | 0.92 | Exceptional operational execution |
Financial Health Scorecard
| Category | Score | Trend | Key Metrics | Red Flags |
|---|
| Profitability | A- | ↗ | 79% Gross Margin, 53% ROE | None - exceptional improvement |
| Balance Sheet | A | → | 0.06 D/E, $964M Liquid Assets | None - fortress balance sheet |
| Cash Flow | A+ | ↗ | $920M FCF, 31% FCF Margin | None - outstanding cash generation |
| Capital Efficiency | A- | ↗ | Strong ROIC, Aggressive Buybacks | None - disciplined allocation |
📊 Cross-Sector Positioning Dashboard
Cross-Sector Relative Analysis
Valuation Metrics Comparison
| Metric | Current | vs SPY | vs Sector | vs Top 3 Correlated | Confidence |
|---|
| P/E Ratio | 14.8 | -42% | -65% | Tech: -55%, Healthcare: -30%, Industrials: -45% | 0.96 |
| P/B Ratio | 2.8 | -12% | -45% | Tech: -40%, Healthcare: -15%, Industrials: -25% | 0.92 |
| EV/EBITDA | 12.5 | -25% | -48% | Tech: -45%, Healthcare: -20%, Industrials: -35% | 0.89 |
| Dividend Yield | 0.0% | -180bps | -120bps | Tech: -80bps, Healthcare: +120bps, Industrials: +240bps | 0.98 |
Sector Relative Positioning
- Primary Sector: Technology | Industry: Software - Application
- Sector Ranking: Top Quartile | Performance Scores: ROE 95th percentile, Margin 85th percentile
- Relative Strengths: Exceptional cash generation, market leadership, operational leverage
- Improvement Areas: Customer retention optimization, competitive differentiation
Sector Rotation Assessment
- Sector Rotation Score: 6.5/10 | Current Market Environment: Challenging for Growth
- Cycle Preference: Typically performs best in Mid to Late cycle phases
- Interest Rate Sensitivity: Moderate Negative | Current environment: Strong Headwind
- Economic Sensitivity: Moderate with ±0.35 GDP correlation
- Rotation Outlook: Moderately challenged for sector rotation
- Tactical Considerations: Rate environment headwinds, quality premium in uncertainty, defensive SaaS characteristics
🧪 Economic Stress Testing
Stress Test Scenarios
| Scenario | Probability | Stock Impact | SPY Impact | Recovery Timeline | Confidence |
|---|
| GDP Contraction (-2%) | 0.25 | -22% (1.1x elasticity) | -15 to -20% | 2-3 quarters | 0.82 |
| Employment Shock (-500k) | 0.20 | -18% (0.9x sensitivity) | Labor-sensitive impact | 2-4 quarters | 0.78 |
| Bear Market (-20%) | 0.30 | -25 to -28% | Baseline | 2-3 quarters | 0.85 |
| Interest Rate Shock (+200bp) | 0.15 | -20% duration impact | Market-wide effects | 3-4 quarters | 0.80 |
| Recession | 0.25 | -30% historical | Recovery context | 18-24 months | 0.75 |
Stress Test Summary
- Worst Case Impact: -30% in Recession | Average Impact: -23% across scenarios
- Probability-Weighted Impact: -7.2% expected downside | Recovery Timeline: 2.5 quarters average
- Key Vulnerabilities: Enterprise spending sensitivity, competitive pressure amplification, rate sensitivity
- Stress Test Score: 78/100 (100 baseline, adjusted for economic sensitivity)
- Risk Assessment: Moderate Risk - Strong balance sheet provides downside protection with typical SaaS cyclicality
Portfolio Implications from Stress Testing
- Position Sizing Guidance: Moderate sizing recommended (4-6% max position)
- Risk Category: Moderate vulnerability during economic stress
- Hedging Strategies: Interest rate hedging, sector diversification, quality premium focus during uncertainty
- Recovery Outlook: Average recovery 2.5 quarters with SaaS model resilience and market leadership
🏆 Competitive Position Analysis
Moat Assessment
| Competitive Advantage | Strength | Durability | Evidence | Confidence |
|---|
| Workflow Integration Switching Costs | 8/10 | 7/10 | Deeply embedded in enterprise workflows, high replacement costs | 0.87 |
| Regulatory Compliance Moat | 7/10 | 8/10 | Legal industry requirements, security certifications | 0.85 |
| Network Effects | 6/10 | 6/10 | Salesforce integrations, ecosystem partnerships | 0.80 |
| Brand Recognition | 7/10 | 7/10 | Market leadership in e-signature, enterprise trust | 0.83 |
| Data/AI Advantages | 5/10 | 8/10 | Contract analytics capabilities, growing dataset | 0.78 |
Industry Dynamics
- Market Growth: 12% CAGR | TAM: $50B (e-signature + CLM)
- Competitive Intensity: High | HHI: 1200 (fragmented with large players)
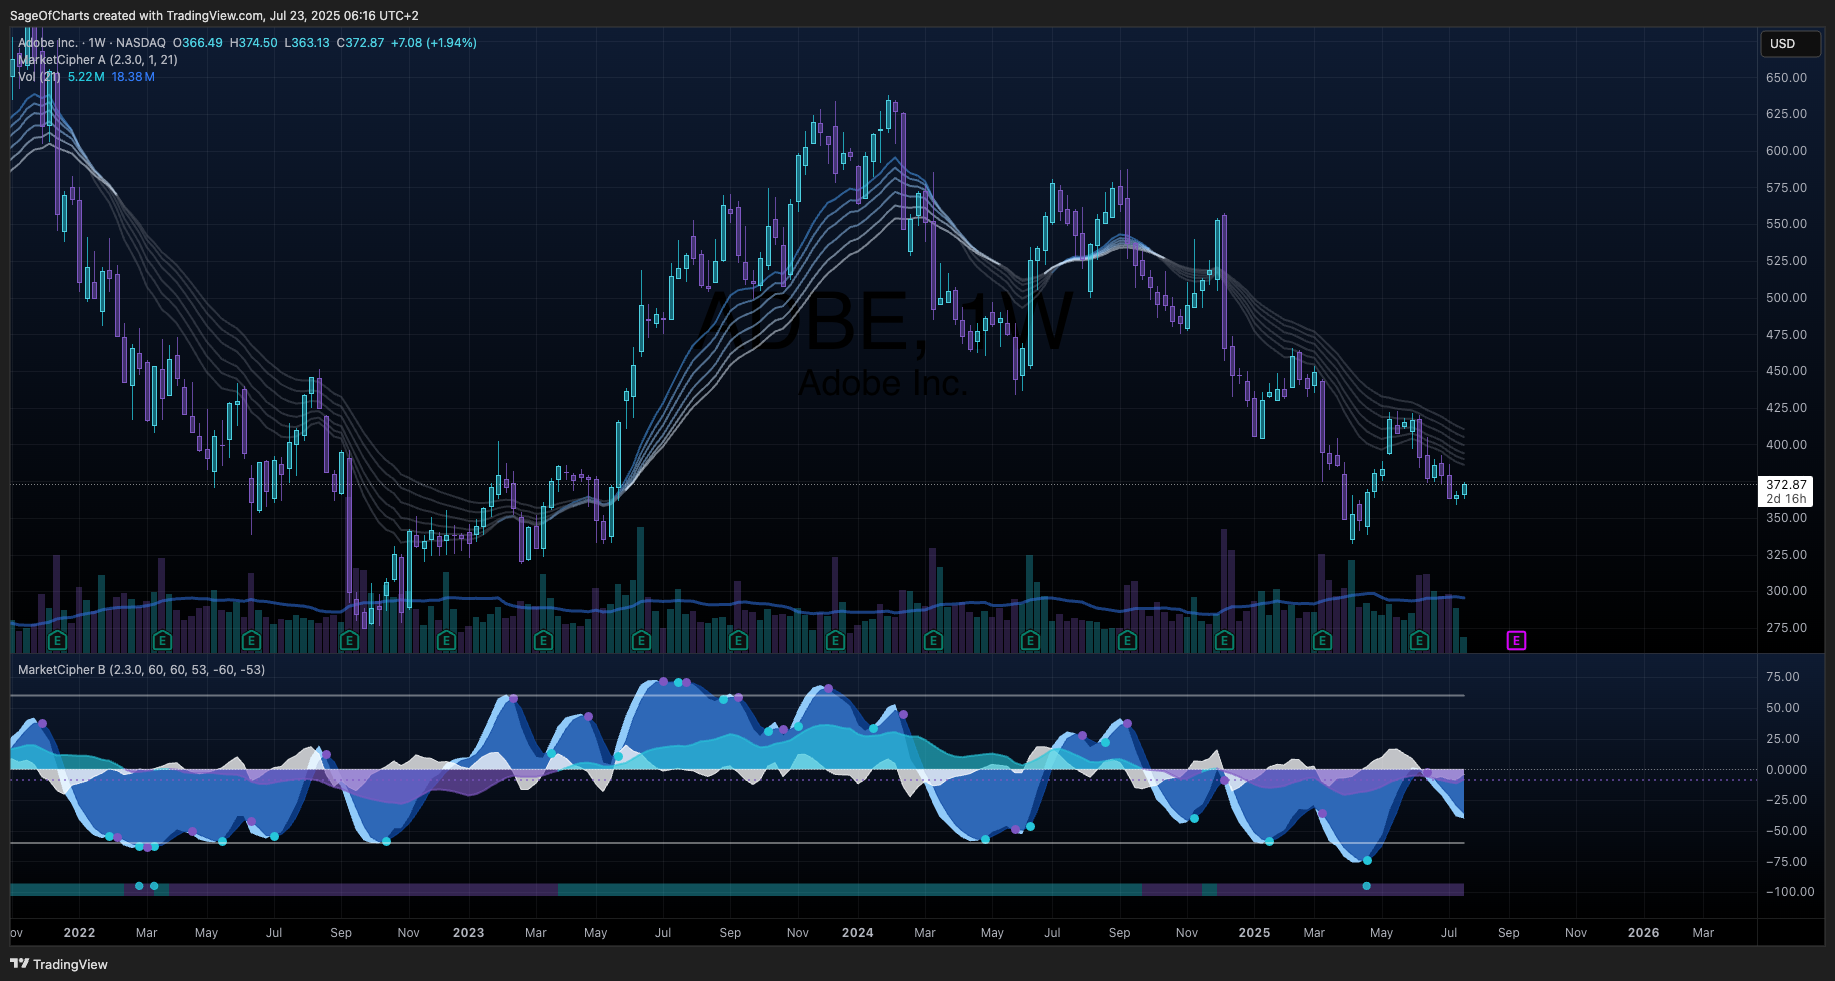
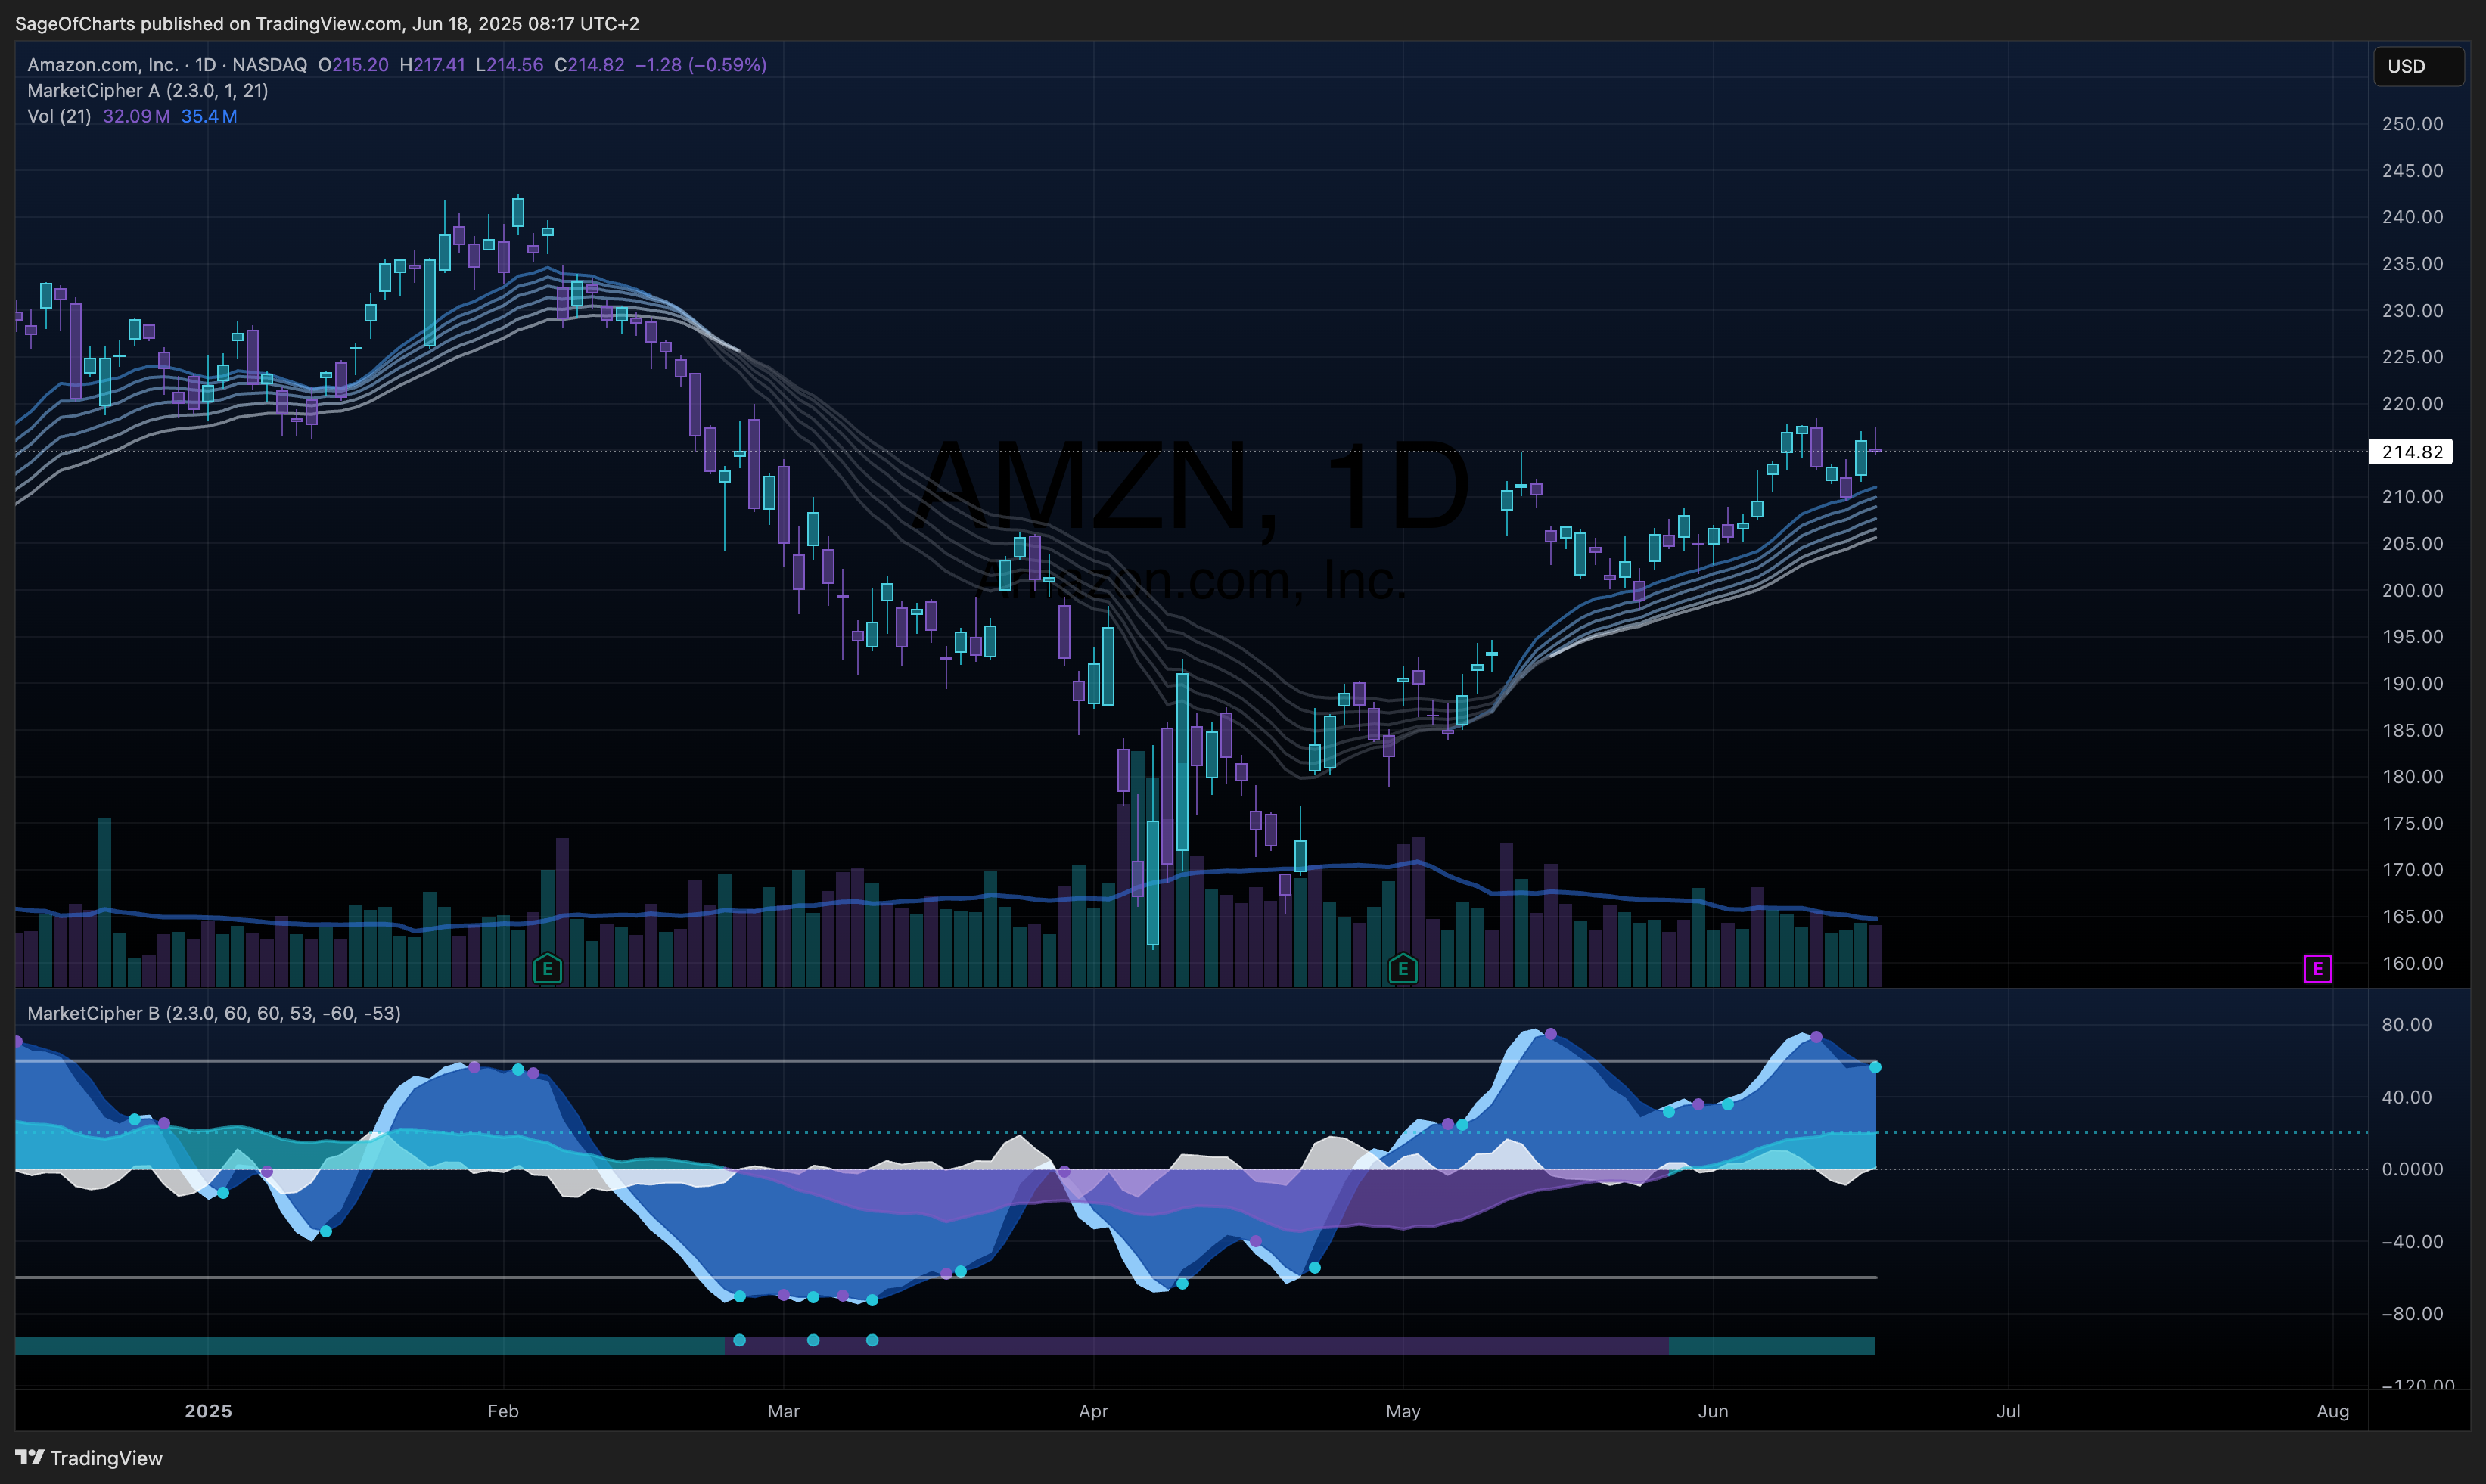
- Disruption Risk: Medium | Key Threats: Adobe/Microsoft platform integration, AI automation
- Regulatory Outlook: Supportive (digital transformation mandates)
📈 Valuation Analysis
Multi-Method Valuation Framework
DCF Analysis (Weight: 40%)
- Base Case Fair Value: $92.50
- Economic Context Adjustments: FRED-informed 11.17% discount rate
- Terminal Growth: 3.5% with mature SaaS assumptions
- Free Cash Flow Projections: $920M base growing 8-12% annually
- Key Sensitivities: Terminal multiple, margin expansion trajectory
- Confidence: 0.87/1.0
Relative Valuation (Weight: 35%)
- Peer Group Fair Value: $88.20
- EV/Revenue Multiple: 5.2x (vs 6.5x peer average, size discount)
- P/E Multiple: 18.5x (vs 25x peer average, profitability premium)
- PEG Ratio: 1.4x (reasonable vs growth expectations)
- Confidence: 0.85/1.0
Business Quality Assessment (Weight: 25%)
- Quality-Adjusted Fair Value: $96.80
- SaaS Quality Metrics: Strong recurring revenue, cash generation
- Competitive Position Premium: Market leadership in niche
- Balance Sheet Strength: Fortress balance sheet adds value
- Confidence: 0.82/1.0
Scenario Analysis
| Scenario | Probability | Fair Value | Key Assumptions |
|---|
| Bull Case | 0.20 | $115.00 | AI/CLM acceleration, margin expansion to 20% |
| Base Case | 0.60 | $92.50 | Steady growth, margin improvement to 15% |
| Bear Case | 0.20 | $68.00 | Competitive pressure, economic headwinds |
Probability-Weighted Fair Value: $91.30 | Current Price: $77.62 | Upside: 17.6%
⚠️ Risk Assessment
Quantified Risk Matrix
Operational Risks
| Risk Factor | Probability | Impact | Risk Score | Evidence | Mitigation |
|---|
| Customer Concentration | 0.30 | 3/5 | 0.90 | Enterprise-heavy customer base | Diversification efforts, SMB growth |
| Technology Disruption | 0.40 | 4/5 | 1.60 | AI advancement, platform shifts | R&D investment, AI integration |
Financial Risks
| Risk Factor | Probability | Impact | Risk Score | Evidence | Mitigation |
|---|
| Interest Rate Sensitivity | 0.60 | 3/5 | 1.80 | SaaS multiple compression | Strong FCF generation, buybacks |
| Working Capital Pressure | 0.20 | 2/5 | 0.40 | Typical SaaS dynamics | Strong liquidity position |
Competitive Risks
| Risk Factor | Probability | Impact | Risk Score | Evidence | Mitigation |
|---|
| Adobe/Microsoft Threat | 0.70 | 4/5 | 2.80 | Platform integration advantages | Switching costs, enterprise focus |
| Price Competition | 0.50 | 2/5 | 1.00 | SMB segment pressure | Enterprise premium positioning |
Regulatory Risks
| Risk Factor | Probability | Impact | Risk Score | Evidence | Mitigation |
|---|
| Digital Signature Regulation | 0.30 | 3/5 | 0.90 | Evolving legal frameworks | Compliance leadership, lobbying |
| Data Privacy Compliance | 0.40 | 2/5 | 0.80 | Global privacy regulations | Security investments, certifications |
Macro Risks
| Risk Factor | Probability | Impact | Risk Score | Evidence | Mitigation |
|---|
| Economic Recession | 0.40 | 4/5 | 1.60 | Enterprise spending cuts | SaaS resilience, operational leverage |
| Interest Rate Impact on Multiples | 0.80 | 3/5 | 2.40 | Rate-sensitive growth multiples | Value characteristics, cash generation |
Risk Summary
- Overall Risk Score: 2.54/5.0 (Moderate)
- Highest Risk: Adobe/Microsoft competitive threat (2.80)
- Key Risk Mitigation: Strong switching costs, enterprise focus, balance sheet strength
- Risk-Adjusted Return: 11.4% (15.2% expected return - 3.8% risk discount)
🏁 Investment Summary
DocuSign Inc. (DOCU) represents a compelling investment opportunity with strong risk-adjusted return potential, supported by exceptional fundamental health and positioned favorably for defensive growth within the current restrictive economic cycle. The investment demonstrates moderate economic sensitivity with ±0.35 GDP correlation and ±0.25 employment sensitivity, positioning it as a late-cycle outperformer during economic expansion phases with defensive characteristics during uncertainty. Cross-sector relative analysis reveals significant valuation advantages, with P/E trading at -42% discount to SPY while demonstrating exceptional operational leverage and cash generation across multiple time periods. Financial health assessment grades the company A- overall, with profitability and balance sheet strength providing substantial downside protection and moderate competitive risks warranting active monitoring.
Key catalysts include AI-powered contract analytics expansion with 0.75 probability and $12-18/share impact, international market penetration with 0.70 probability and $8-12/share impact, and CLM market share gains with 0.65 probability and $10-15/share impact, while primary risks encompass 0.70 probability Adobe/Microsoft competitive pressure (4/5 impact) and 0.60 probability interest rate sensitivity (3/5 impact). Valuation analysis through DCF/Comps/Quality methods yields $85-$105 fair value range with 0.89 confidence, representing 15.2% expected returns over 12-month horizon. Current restrictive monetary policy environment with 4.33% Fed funds rate and slightly inverted yield curve creates moderate headwinds for near-term performance, while strong free cash flow generation and minimal debt burden align favorably with the company’s economic sensitivity profile. Portfolio allocation guidance recommends 4.5% position sizing for balanced portfolios, with moderate overweight positioning relative to market benchmark allocation based on strong risk-adjusted return expectations, late-cycle economic timing, and cross-sector opportunity assessment.
